
Measure a computer and a process electricity consumption with a wattmeter#
Note
For this lab, you have to work on the lab room PCs. Wattmeters are installed on these PCs.
Objectives
In this lab, you will discover the use of a wattmeter with a software API to measure the power and the energy of the computer.
We will do the following exercices:
Discover the Yocto-Watt wattmeter
Measure the energy consumed by the computer while idle (doing nothing special) for a given period of time
Measure the energy consumed by the computer while streaming a short video in different definitions
from those measures you will be able to observe the impact of video resolution on energy consumption
Study the impact of the programming language on energy consumption:
Measure the energy consumed for computing the Mandelbrot Fractal set in Java and in Python
Differences in the measures and Advantages/disadvantages between Wattmeter and perf (if you have already done the perf lab)
To be able to reach those objectives in a reduced period of time, we provide you with some scripts in Python.
1. Discover the Yocto-Watt (20mn)#
Initialisations#
Python installation#
If you have not yet done the Perf lab, you first have to activate a python environment with the required modules as described on the following page:
Activate the python environment#
In all the terminals used for this lab, activate the pythonenv environment:
source $HOME/pythonenv/bin/activate
Download Wattmeter lab scripts#
The labs will be done in the $HOME/ENV4101 directory. Create this directory and go to that directory.
mkdir -p $HOME/ENV4101
cd $HOME/ENV4101
Then get the python scripts used in this lab:
wget https://www-inf.telecom-sudparis.eu/COURS/cen/Mesures/tp-wattmeter.zip
unzip tp-wattmeter.zip
cd tp-wattmeter
Connection and discovery of the Yocto-Watt#
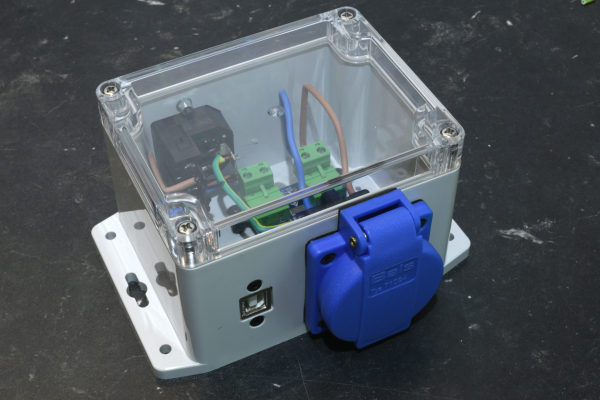
Yocto Wattmeter#
Note
If you need, you can access the Yocto-Watt documentation
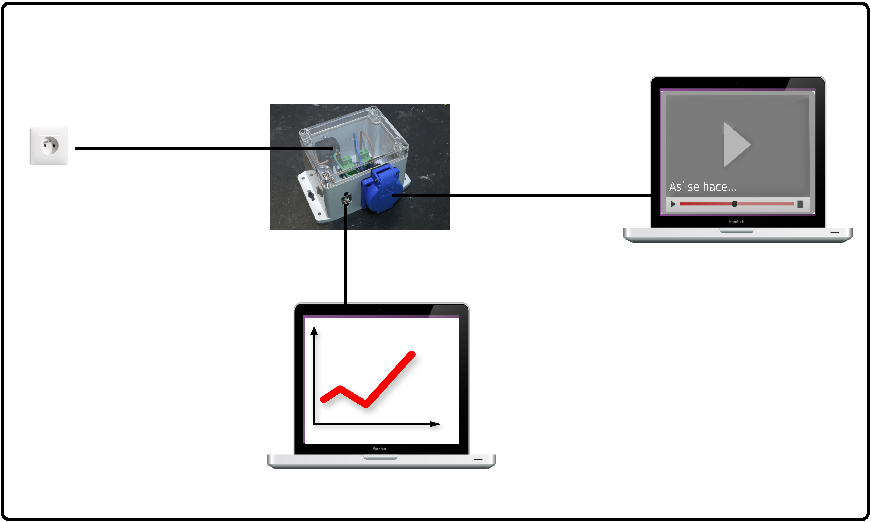
Connection of the Yocto-Watt#
The computer is plugged to the power supply through the wattmeter, which is then able to measure the energy consumption of the computer. The USB cable of the wattmeter is plugged to your computer and allows you to read the measures. The computer that reads the measures and the computer that is measured may be different.
Connection of the Yocto Wattmeter#
Check that the (blue) LED on the Yocto-Watt is on.
Discovering the Yocto Wattmeter through the VirtualHub#
The VirtualHub is a process that is already started on the computers of the lab room. It interacts with the Yocto-Wattmeter to provide the data read from the Wattmeter. It provides a web interface accessible on port 4444.
To access the VirtualHub, open a navigator and go to the URL http://localhost:4444/
Once the VirtualHub interface is open, click on the Yocto-Watt line, and read the following values:
Power
Energy
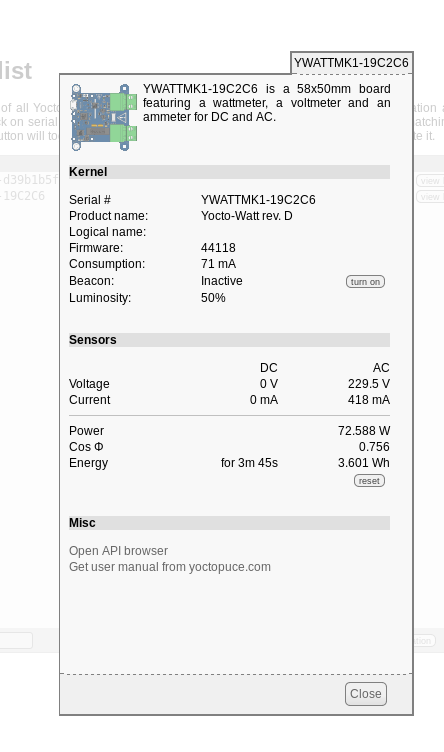
Interface of the VirtualHub#
Energy measure#
What do you notice? What should you do to correctly measure the energy consumed by the computer during a given activity?
Tip
Details
The power is not stable. It depends on the activity of the computer. It may impact the measures that you will realize.
As for any measure, you need to do the measures several times and calculate the mean and standard deviation.
In the interface, you have a reset button, to reset the energy consumption meter.
2. Idle state consumption (~5 minutes)#
Note
In this part you will have to close all the running applications before making the measurement.
You can now measure the idle state consumption of your computer using the python program measure_idle_state.py which you have downloaded before.
Explanation on the measure_idle_state.py script
This command takes two arguments: the number of measurements you want to perform and the duration of the measurement in seconds.
In this python script, the lines that interact with the Yocto-Watt are:
power = YPower.FirstPower()initiates the access to the Yocto-Watt data
Then there is a loop with the number of measurements to perform:
power.reset()resets the energy meter on the yocto-wattpower.get_meter()gets the energy meter from the yocto-watt in Wh (since the last reset)
Then it prints the mean and the standard deviation.
In order to test it quickly, run it for 3 measures of 2 seconds. The result of this command is the mean of the energy consumption in Joules for a period of 2 seconds.
python3 measure_idle_state.py 3 2
To have a slightly better estimation of the idle consumption, we will make 3 measures of 30 seconds.
python3 measure_idle_state.py 3 30
The results of the last command have been saved in the IDLE_state.csv file, it will be used in the next step of the lab. You can see it with
cat IDLE_state.csv
Bravo!
Congratulations, you have been able to perform a first evaluation of the energy consumption of your computer when it was “idle” for 30 seconds!
Remark
To have a better evaluation, we should stop more processes, and measure the energy consumption on a longer period.
If you want to have an idea on the number of processes that are running on your computer you can test those commands:
ps -u $USER # your processes
ps -u $USER |wc -l # the number of your running processes
ps -ax # all the processes
ps -ax|wc -l # the number of running processes
This computer is not your own computer, you can only stop the processes that you have started (such as navigators, editors). Be aware that there are a lot of daemons (processes that run forever). If it were your own computer, you could limit the running processes to the strict minimum.
3. Online streaming and impact of video resolution (~20 minutes)#
Objectives
We will now study the energy consumption of the computer while watching online video. Our objective is to watch the same video for 30 seconds with various resolutions and see if there is an impact in terms of energy consumption.
If you are interested on the impact of the video on energy consumption, you can read this report from the Shift Project.
Measure the impact of video resolution with 3 common resolutions#
You will use this script
With this script, we:
Measure the energy consumed by the video for 30 seconds at 3 different resolutions: 360p, 720p and 1080p. Because we do not have much time, we only run each video once. For better estimation, we should obviously run more.
Substract the “Idle” measure you saved in IDLE_state.csv file
Plot a curve of the energy consumption according to the resolution.
Save the graphs in your working directory and show the resulting png on your computer. There are two graphs (you can navigate through the two graphs with the arrows)
the first one shows the total consumption of the computer
the second one shows the estimation of the consumption of streaming the video only (substracts the Idle consumption)
To run the command
First make sure that no process is started on your account (navigators, editors, …).
Then, run the following command. This script launches the view of a 30 seconds long video (in the chrome navigator), 3 times, each time with a different resolution. Just be patient and let the videos run, three times, before analyzing the results.
sh watch_online_video_simple.sh
Analyse the results#
Comment on the impact you observe of the video resolution on the power consumption of your computer.
Imagine the impact of higher resolutions such as:
Two high resolution formats:
HD (high resolution 720p): 1 280 pixels per row × 720 rows (the last we have used)
Full HD (1080p ou 1080i): 1 920 × 1 080, or approximately 2 million pixels per image.
Two very high definition formats
UHD (ultra high definition): 3 840 × 2 160, 4 times more pixels than in Full HD. This 16:9 format is particularly suitable for watching movies on a television;
4K: 4 096 × 2 160, little more than UHD with a cinema format.
Bravo!
Congratulations, you have been able to comment on the impact of video resolution on energy consumption!
In the future, we advise you to choose a sober and appropriate resolution while looking at your favorite videos!
4. Comparison of energy consumption of Mandelbrot in Java and in python (20mn)#
Objectives
In this part of the lab, we compare the efficiency of 2 programming languages: Java and Python. From this experiment, you should try to explain the differences in terms of energy consumption between them.
This example has been experimented in the article Ranking programming languages by energy efficiency
Article summary
This study answers the following questions:Can we compare the energy efficiency of programming languages?
Is the fastest language the most energy efficient?
What is the link between memory usage and energy consumption?
Can we find the best language in terms of time, energy and memory?
We test an algorithm that plots the mandelbrot set, one of the best-known examples of mathematical fractal.
The programs come from the Computer language benchmark game. A benchmark which objective is to test the same algorithm written in several languages.
Mandelbrot details
Mandelbrot
The mandelbrot set is defined by the set of complex numbers \(c\) for which the complex numbers \(z_{n}\) of the sequence remain bounded in absolute value. The sequence \(z_{n}\) is defined by:
\(z_{0}=0\)
\(z_{n+1}=z_{n}^{2}+c\)
To learn more about mandelbrot :
Video explanation on Mandelbrot set by Dr Holly Krieger from MIT.

Mandelbrot set fractal example#
Run the experiment#
Launch the experiment first (it takes some time) and while it is running:
Read the explanations below
Read the analysis question and try to guess the answers
sh run_mandelbrot_wattmeter.sh
In this experiment, you plot the Mandelbrot set \((-1.5-i,0.5+i)\) on an N-by-N bitmap and write output byte-by-byte in portable bitmap format.
Important
The calculations are intensive, your processor is running at full speed, it is likely that your computer seeks to cool, do you hear the fan whirring?
On some computers the running may be very very long several minutes for the 16000 parameter.
There is a first loop to vary the bitmap precision (N) to compute the fractal image with different levels of details (160, 1600, 3200, 8000 and 16000).
There is a second loop to do the computation twice for computing mean and standard deviation (for sake of time, we do it only twice. It should be done more to improve the standard deviation. Feel free to augment the number for a better result).
Compute the fractal with two languages java and python
The bitmaps are saved and you can visualize them (at the end of the experiment)
display language_comparison/mandelbrot_bitmap/*.bmp &
We measure the energy before and after each computation with
power.get_meter()and store the difference as well as the execution time in milliseconds in the filelanguage_comparison/results_wattmeter/output_mandelbrot.csvcat language_comparison/results_wattmeter/output_mandelbrot.csv
Plot the graphs time, power and energy in function of the bitmap definition
Show the graphs
display language_comparison/results_wattmeter/*.png &
Note
NB: For this experiment, we plot the total energy consumption, we did not remove the idle consumption.
Analyse the results and answer the following questions#
NB: The graphs are saved in the language_comparison/results_wattmeter directory.
Is there a link between the execution time and the energy?
What is the impact of the bitmap definition parameter on the power?
Which language is the most energy consuming and why?
Bravo!
Congratulations, you have been able to comment on the impact of the programming language on energy consumption!
In the future, we advise you to choose a sober programming language when you develop widely used software!
5. Differences in the measures and Advantages/disadvantages between Wattmeter and perf (15mn)#
If you have already realized the lab with perf, we ask you (if not you will answer those questions in the perf lab and go directly to the next question)
What are the differences between the measures obtained with the wattmeter and those obtained with perf for ploting the mandelbrot? Analyze those differences.
Do we have the same energy measure? Why?
With a Wattmeter and with perf, how do you isolate the energy consumption of one process or activity?
What is the power measure sampling rate with perf and with Yocto-watt?
Which tool is the easiest to use?
Bravo!
Have you been able to differentiate Wattmeter and perf characteristics?
6. Impact of network intensive operation on energy consumption (30mn)#
Write a shell script to measure the energy consumption when you download a file (size > 100MB) with wget.
For example, with the following command you download a 169MB file.
What’s next?
If it was your first lab, the next lab is the perf lab, where you will measure at the level of the processor.
If it is your second lab,
In the next lab, we will see a new tool Joular-JX that is able to measure the consumption of a java activity
and that is able to find the methods/classes the most energy-consuming.