
Measure of a processor electricity consumption with a software meter#
Note
For this lab, you have to work on the lab room PCs. Likwid use RAPL that is only available on some processors.
NB: Likwid only measures the power and energy for the CPU and memory components of the computer.
Objectives
In this lab, you will discover the use of a software energy meter to measure the power and the energy of the CPU and memory components.
We will do the following exercices:
Discover likwid
Measure the energy consumed by the computer while idle (doing nothing special) for a given period
Study the impact of the programming language on energy consumption:
Measure the energy consumed for computing the Mandelbrot Fractal set in Java and in Python
Differences in the measures and Advantages/disadvantages between Wattmeter and likwid (if you have already done the wattmeter lab)
Calculate carbon impact of a functional unit with the Software Carbon Intensity formula
0. Discover Likwid (20mn)#
Initialisations#
The whole lab will be done in the $HOME/ENV4101/LikwidLab directory. Create this directory and go to that directory.
mkdir -p $HOME/ENV4101
mkdir -p $HOME/ENV4101/LikwidLab
cd $HOME/ENV4101/LikwidLab
Get the python scripts used in this lab
wget https://www-inf.telecom-sudparis.eu/COURS/cen/Mesures/tp-likwid.zip
unzip tp-likwid.zip
RAPL and Likwid in two words#
RAPL states for Running Average Power Limit Energy Reporting. It is provided by some INTEL processors. With RAPL, the power measurement is provided by counters integrated into the CPU. The CPU counters are made available through specific registers which we can access by software. As you can expect, reading specific registers may be complicated and depends on the target architectures. There are many tools that allow us to read RAPL CPU counters. In this lecture, we will focus on LIKWID.
LIKWID provides a large panel of possible measurements. They depend on the target processor. LIKWID automatically detects the processor generation and all the required information. If you want to know your processor family, you can execute cat /sys/devices/cpu/caps/pmu_name in your terminal.
The processor that you will use for this lecture is an Intel Skylake. LIKWID webpage about Skylake
shows that many measurements are possible on such processors. The FLOPS_DP group provides information on the performance of the application being executed. The ENERGY group allows access to the power and energy information. We will focus on the latter.
Discover the architecture of your computer#
hwloc-ls provides a hierarchical view of the machine. It also gathers various attributes such as cache and memory information.
To see the architecture of your computer you can use this command:
hwloc-ls
For example here is the output for the b02-02 computer:
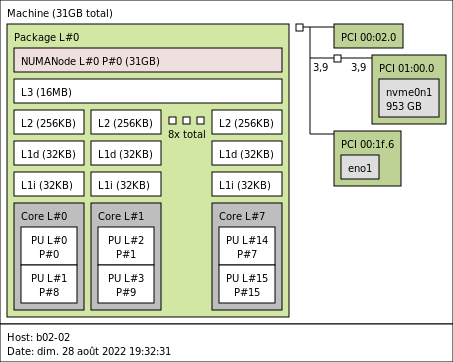
Architecture of a lab computer#
We can see :
The Package (named also socket, or processor), (e.g. L#0). A processor Package is the physical package that usually gets inserted into a socket on the motherboard. It is also often called a physical processor or a CPU, even if these names bring confusion with respect to cores and processing units. The package is one of the entities for which the energy consumption is measured by RAPL. Inside the package:
The cores (e.g. Core P#0) with their processors units or hyper-threads (e.g. PU L#0). For this computer the package has 8 cores with 2 hyper-threads each.
The memory caches (L*), where data and programs that are used regularly by your processor are stored. The memory caches are smaller than the DRAM. Processors have a faster access to this cache than to the DRAM.
The size of the main memory (DRAM) is indicated (e.g. 31GB in this figure) it is the second entity for which RAPL measures energy consumption
The PCI devices (audio card, disk, and ethernet interface), no energy consumption are measured by RAPL for those components.
Energy measure#
With Likwid we can obtain the consumed energy by the processor and the DRAM during the execution of one command.
Now let us look at how we can measure the energy consumed by a command.
For this lecture, in order to retrieve the energy consumption, we will use likwid-perfctr. One of the reasons of using it is that we can provide the command line used to start an application to likwid-perfctr. Then, at the end of the execution of the application, it will display how much energy was consumed.
For example with this command we measure the energy consumed while sleeping for 1 second :
likwid-perfctr -g ENERGY “sleep 1”
At the end of the execution, LIKWID prints several tables. For now, let us look at the second one (counters) and the last one (synthesis results).
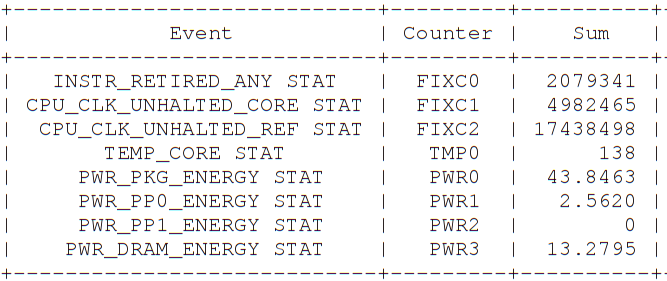
Energy counters provided by LIKWID:#
We will look particularly at two counters:
PWR0, which provides PWR_PKG_ENERGY, the average power consumed by the package or processor (in Joules)
PWR3, which provides PWR_DRAM_ENERGY, the average power consumed by the DRAM component (in Joules)
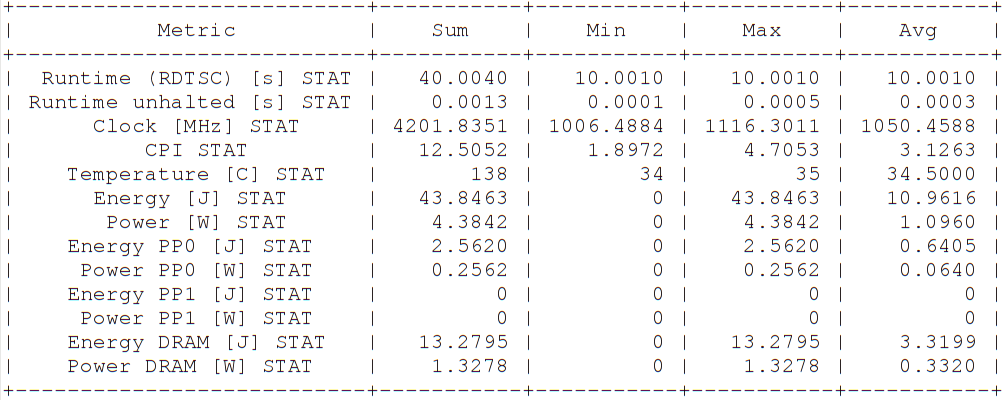
Statistics provided by LIKWID#
1. Idle state consumption with a script (~5 minutes)#
Note
In this part you will have to close all the running applications before making the measurement.
You can now measure the idle state consumption of your computer using the shell program run_sleep_likwid.sh which you have downloaded before in the zip file.
Explanation on the run_sleep_likwid.sh script
This command takes two arguments: the number of measurements you want to perform and the duration of the measurement in seconds.
Loop with the number of measurements to perform:
likwid-perfctr -c 0 -g PWR_PKG_ENERGY:PWR0,PWR_DRAM_ENERGY:PWR3 "sleep $duration" |tee -a $results_directory/likwid_$i, this line analyse the performance of the commandsleep $duration, the results are shown on the screen and copied to an intermediary result file: for example it he chosen duration is 30 seconds, and the iteration is 1, the file is saved inresults_sleep_30/likwid_1then the
time(duration),pkg_energy(energy in Joules of the processor for the duration),dram_energy(energy in Joules for the memory for the duration) is extracted from the temporary filetime=\((tail -11 \)input | grep Runtime | cut -d”|” -f 4 | tail -11) pkg_energy=\((tail -11 \)input | grep PWR0 | cut -d”|” -f 4 | tail -11) dram_energy=\((tail -11 \)input | grep PWR3 | cut -d”|” -f 4 | tail -11)
Those results are saved in a csv file
results_sleep_30/output.csv
Finally after the loop it runs python mean_of_results_likwid.py results_sleep_30/output.csv that
calculates
pkg_power(the processor energy for 1s)dram_power(the memory energy for 1s)prints the means and standard deviations.
In order to test it quickly, run it for 3 measures of 2 seconds. The result of this command is the mean of the energy consumption in Joules for a period of 2 seconds.
sh run_sleep_likwid.sh 3 2
To have a slightly better estimation of the idle consumption, we will make 3 measures of 30 seconds, don’t do anything on the computer in order to save realistic results usable in the sequel of the lab.
sh run_sleep_likwid.sh 3 30
The results of the last command have been saved in the results_sleep_30/output.csv file, it will be used in the next step of the lab. You can see it with
Bravo!
Congratulations, you have been able to perform a first evaluation of the energy consumption of your computer when it was “idle” for 30 seconds!
Remark
To have a better evaluation, we should stop more processes, and measure the energy consumption on a longer period.
If you want to have an idea on the number of processes that are running on your computer you can test those commands:
ps -u \(USER # your processes ps -u \)USER |wc -l # the number of your running processes ps -ax # all the processes ps -ax|wc -l # the number of running processes
This computer is not your own computer, you can only stop the processes that you have started (such as navigators, editors). Be aware that they are a lot of daemons (processes that run forever), if it was your own computer you could limit the running processes to the strict minimum.
2. Comparison of energy consumption of Mandelbrot in Java and in python (30mn)#
Objectives
In this part of the lab, we compare the efficiency of 2 programming languages: Java and Python. From this experiment, you should try to explain the differences in terms of energy consumption between them.
This example has been experimented in the article Ranking programming languages by energy efficiency
Article summary
This study answers the following questions:Can we compare the energy efficiency of programming languages?
Is the fastest language the most energy efficient?
What is the link between memory usage and energy consumption?
Can we find the best language in terms of time, energy and memory?
We test an algorithm that plots the mandelbrot set, one of the best-known examples of mathematical fractal.
The programs come from the Computer language benchmark game. A benchmark which objective is to test the same algorithm written in several languages.
Mandelbrot details
Mandelbrot
The mandelbrot set is defined by the set of complex numbers \(c\) for which the complex numbers \(z_{n}\) of the sequence remain bounded in absolute value. The sequence \(z_{n}\) is defined by:
\(z_{0}=0\)
\(z_{n+1}=z_{n}^{2}+c\)
To learn more about mandelbrot :
Video explanation on Mandelbrot set by Dr Holly Krieger from MIT.

Mandelbrot set fractal example#
Run the experiment#
Launch the experiment first (it takes some time) and while it is running:
Read the explanations below
Read the analysis question and try to guess the answers
sh run_mandelbrot_likwid.sh
In this experiment, you plot the Mandelbrot set \((-1.5-i,0.5+i)\) on an N-by-N bitmap and write output byte-by-byte in portable bitmap format.
There is a first loop to vary the bitmap precision (N) to compute the fractal image with different levels of details (160, 1600, 3200, 8000 and 16000).
There is a second loop to do the computation twice for computing mean and standard deviation (for sake of time we do it only twice, it should be done more to improve the standard deviation feel free to augment the number for a better result).
Compute the fractal with two languages java and python
The bitmaps are saved and you can visualize them (at the end of the experiment)
display language_comparison/mandelbrot_bitmap/*.bmp &
Plot the graphs time, Average DRAM power, Average PKG power, Total DRAM energy and Total PKG energy in function of the bitmap definition
Show the graphs
Note
NB: For this experiment, we plot the total energy consumption, we did not remove the idle consumption.
Analyse the results and answer the following questions (for this algorithm)#
Is there a link between the execution time and the energy?
Is there a link between the power and the energy, why?
Which language is the most energy consuming and why?
Which component is the most consuming?
Warning
Be careful, don’t generalize those results for all programs, the results may be different for some specific cases.
Bravo!
Congratulations, you have been able to comment on the impact of the programming language on energy consumption!
In the future, we advise you to choose a sober programming language when you develop widely used software!
3. Differences in the measures and Advantages/disadvantages between Wattmeter and likwid (20mn)#
If you have already realized the lab with the wattmeter (if not you will answer those questions in the wattmeter lab and go directly to the next question), we ask you
What are the differences between the measures obtained with the wattmeter and those obtained with likwid for ploting the mandelbrot? Analyze those differences.
Do we have the same energy measure? Why?
With a Wattmeter and with likwid, how do you isolate the energy consumption of one process or activity
What is the power measure sampling rate with likwid and with Yocto-watt?
Which tool is the easiest to use?
Bravo!
Have you been able to differentiate Wattmeter and Likwid characteristics?
4. Calculate carbon impact with the Software Carbon Intensity formula (15mn)#
Use the Software Carbon Intensity formula to calculate in g CO2-eq the impact of the mandelbrot calculation for parameter value 16000 in python and in java.
Get the France energy mix with electricity map; you can get the mean value for the last year
Get your computer CO2 impact with boavitza; NB you take only the production impact, you have already measured the energy for the utilisation phase.
5. Impact of network/disk intensive operation on energy consumption (30mn)#
In the previous exercice (mandelbrot) we have stressed the processor. Now let’s stress also the network and/or the disk. For this purpose we suggest you to use the following commands.
Stress the network: Getting a file from the network, occupies the network interface as well as the processor and the memory.
Get one voluminous file through the network (choose one). We can use those video files with three definitions
360p.mp4: 25M720p.mp4: 63M1080p.mp4: 169M
wget http://www-inf.telecom-sudparis.eu/COURS/cen/Mesures/tp-wattmeter-files/videos/360p.mp4 wget http://www-inf.telecom-sudparis.eu/COURS/cen/Mesures/tp-wattmeter-files/videos/720p.mp4 wget http://www-inf.telecom-sudparis.eu/COURS/cen/Mesures/tp-wattmeter-files/videos/1080p.mp4
Stress the disk: Write in a file 1000 blocks of 124 characters
dd if=/dev/zero of=/tmp/testdd bs=124c count=1000 oflag=dsync
For this purpose, you can adapt the run_sleep_likwid.sh shell script, and run it.
Tip
Details
- We suggest you to copy the file
run_sleep_likwid.shin another file - Then change this new file
- You don't need the duration variable (remove the line and each time it is used)
- Change the name of the
cmdvariable - The command to run with likwid_perfctr
sleep 30has to be changed to the chosen command
In a second time you can estimate the cost of only the command (i.e. substract the idle energy that would have been consumed whatever you have done to the total energy)
For this purpose we provide you with the python script
analyse_with_idle_likwid.pycommandpython analyse_with_idle_likwid.py csv-file-cmd csv-file-idle cmd_name
Tip
Details
For example for wget, it could be (according on what you have written in your shell script)-
csv-file-cmd: results_wget/output.csv -
csv-file-idle: results_sleep_30/output.csv -
cmd: wget
-
Next step#
What next?
If it was your first lab, the next lab is the Wattmeter lab, where you will measure at the level of the processor.
If it is your second lab, in the next lab, we will see a new tool Joular-JX that is able to measure the consumption of a java activity
and that is able to find the methods/classes the most energy-consuming.