Likwid and wattmeter labs: Results and analyze#
General questions#
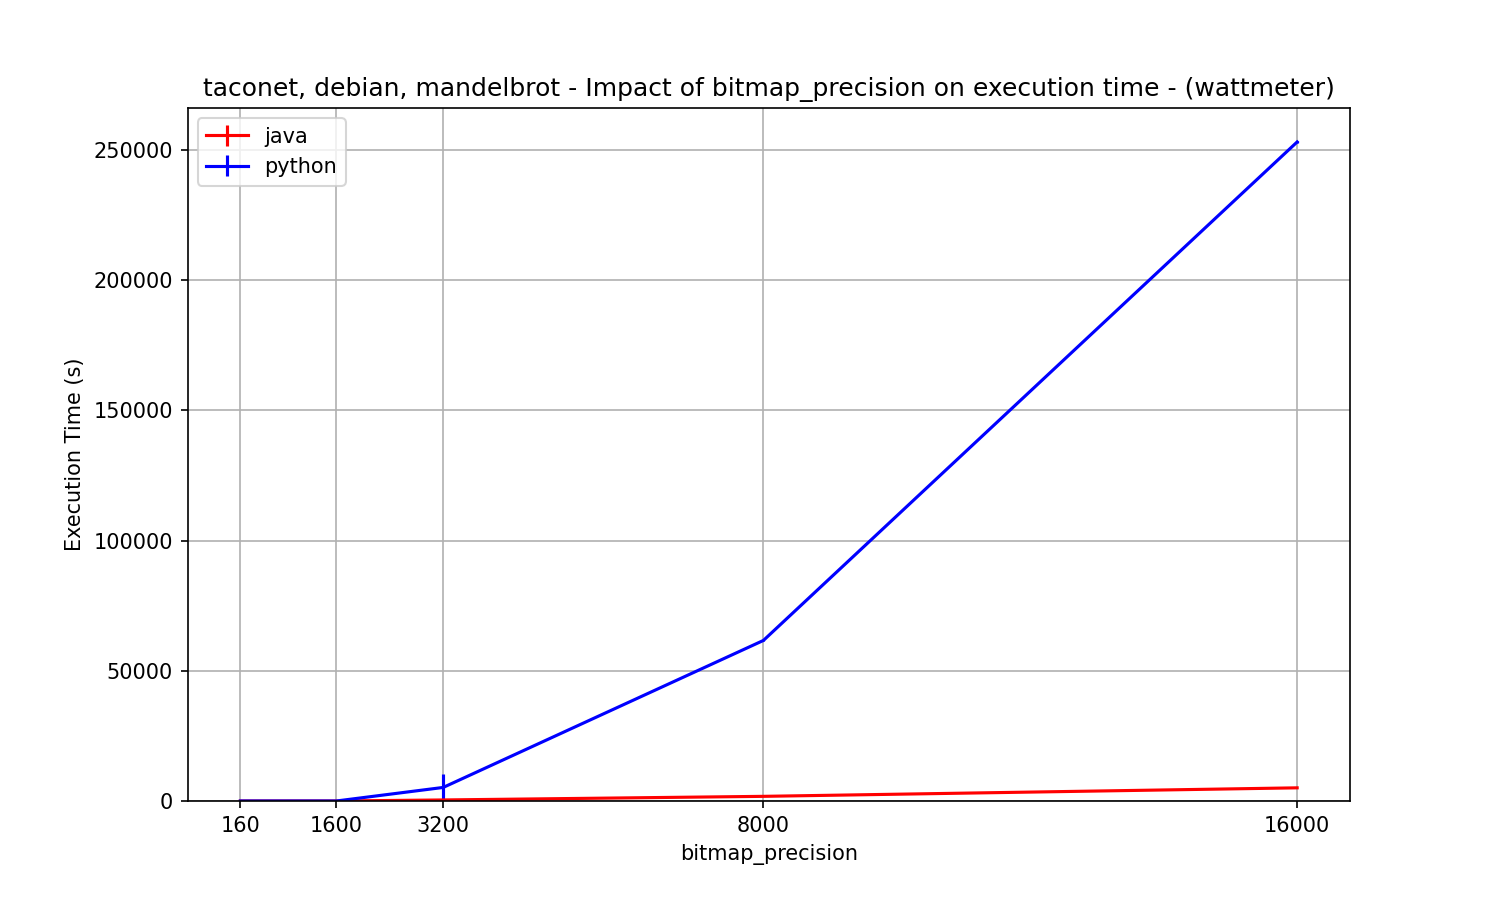
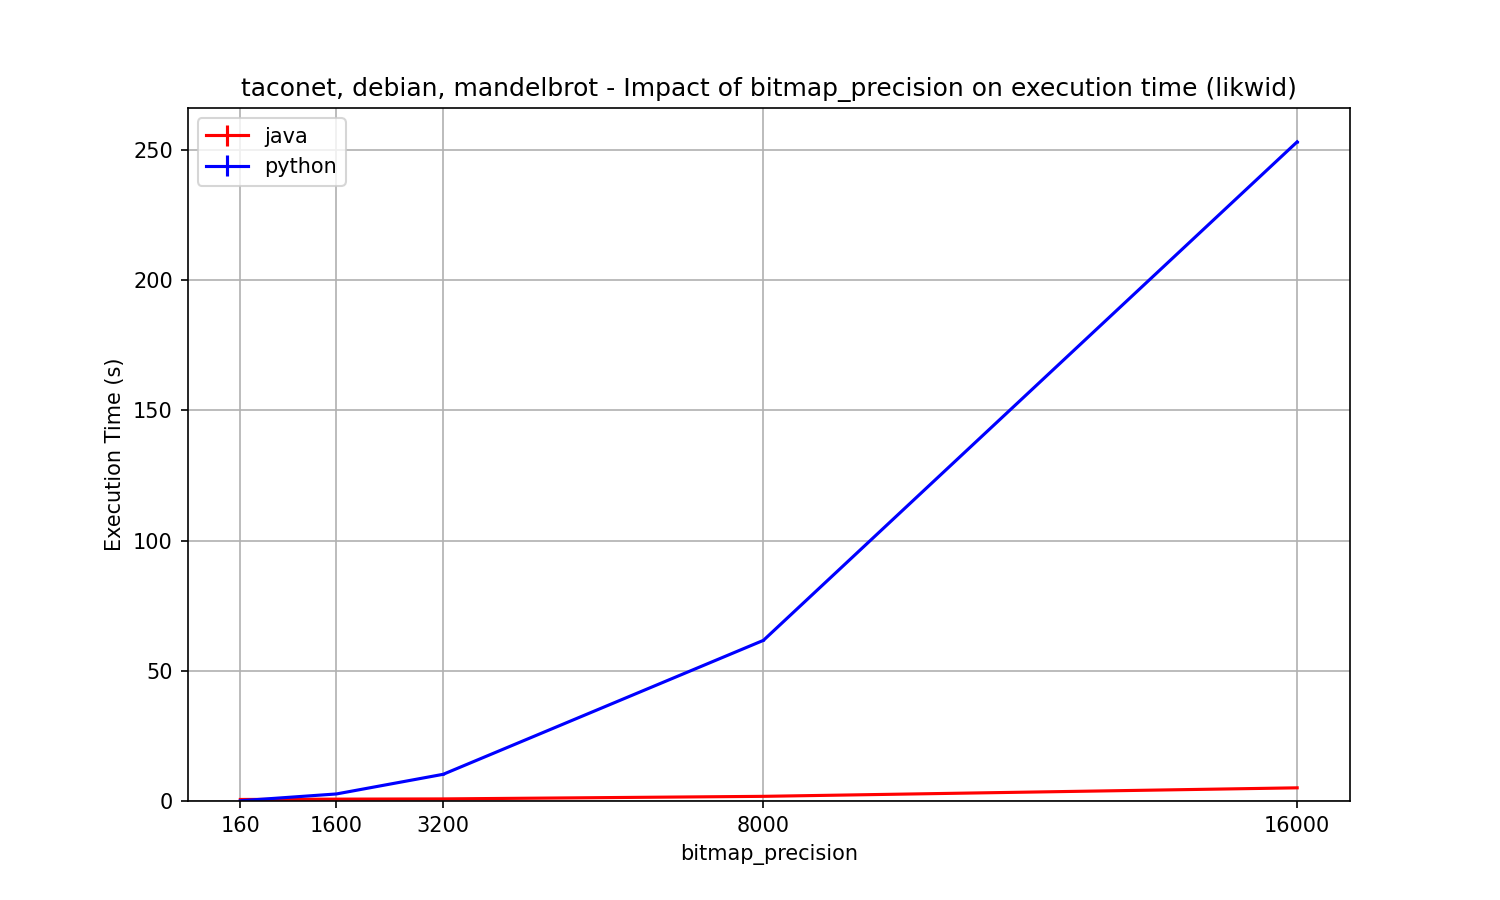
Is there a link between the execution time and the energy ?#
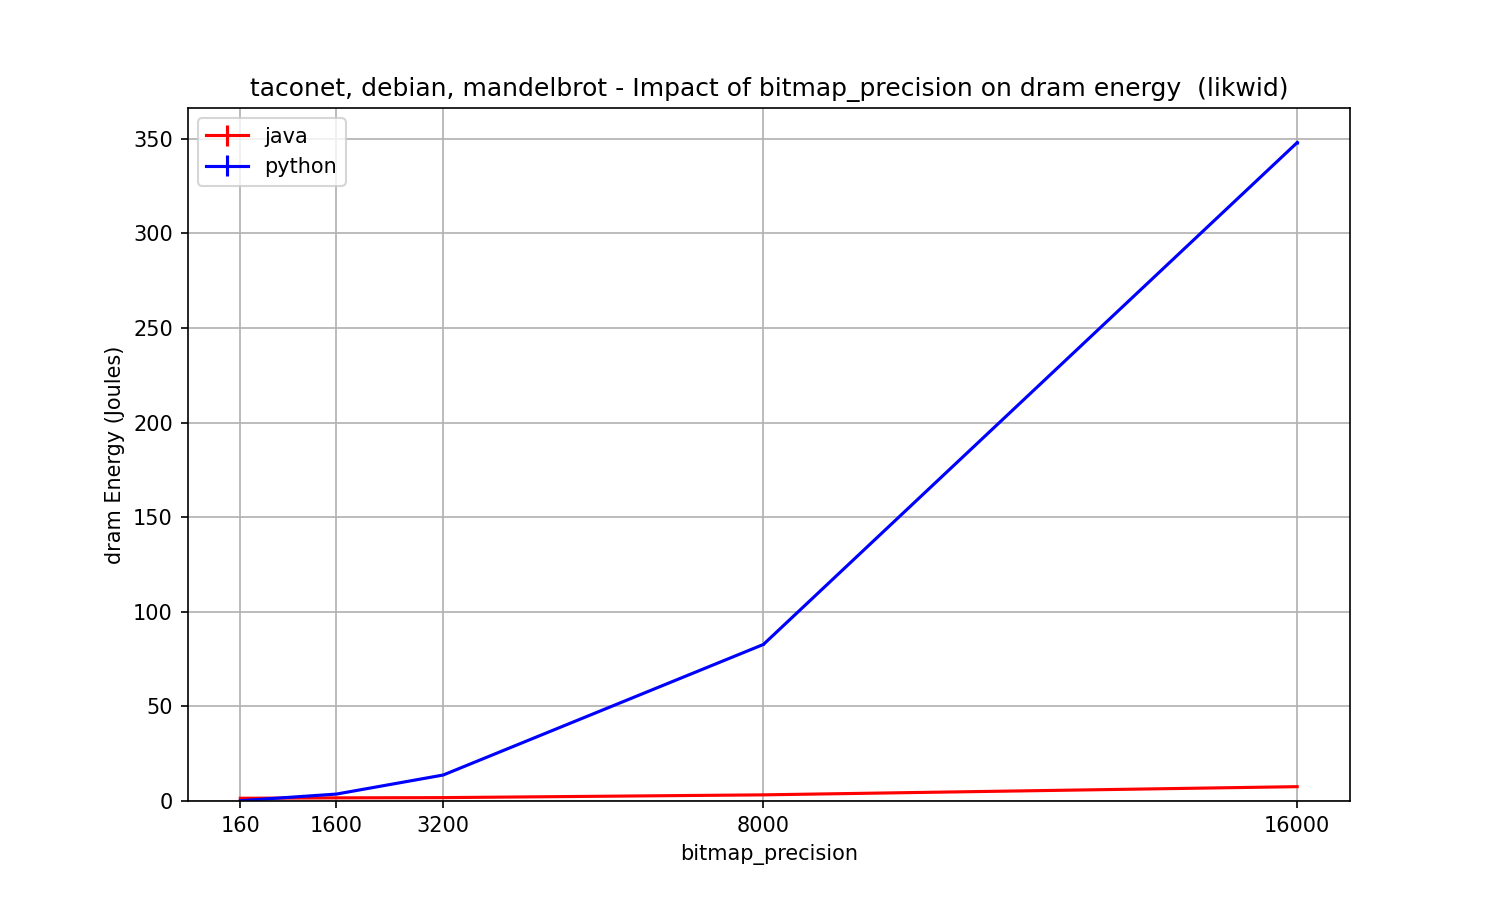
The energy and time curves follow a similar curve. The energy is the integral of the power. If the power was constant, we would have \(E=P\times t\). However, the power is not absolutely constant. And we remark differences between languages and also differences with precision. With Java the energy consumption seems linear, while with Python the energy consumption seems exponential.
What is the impact of the bitmap definition parameter on the power ?#
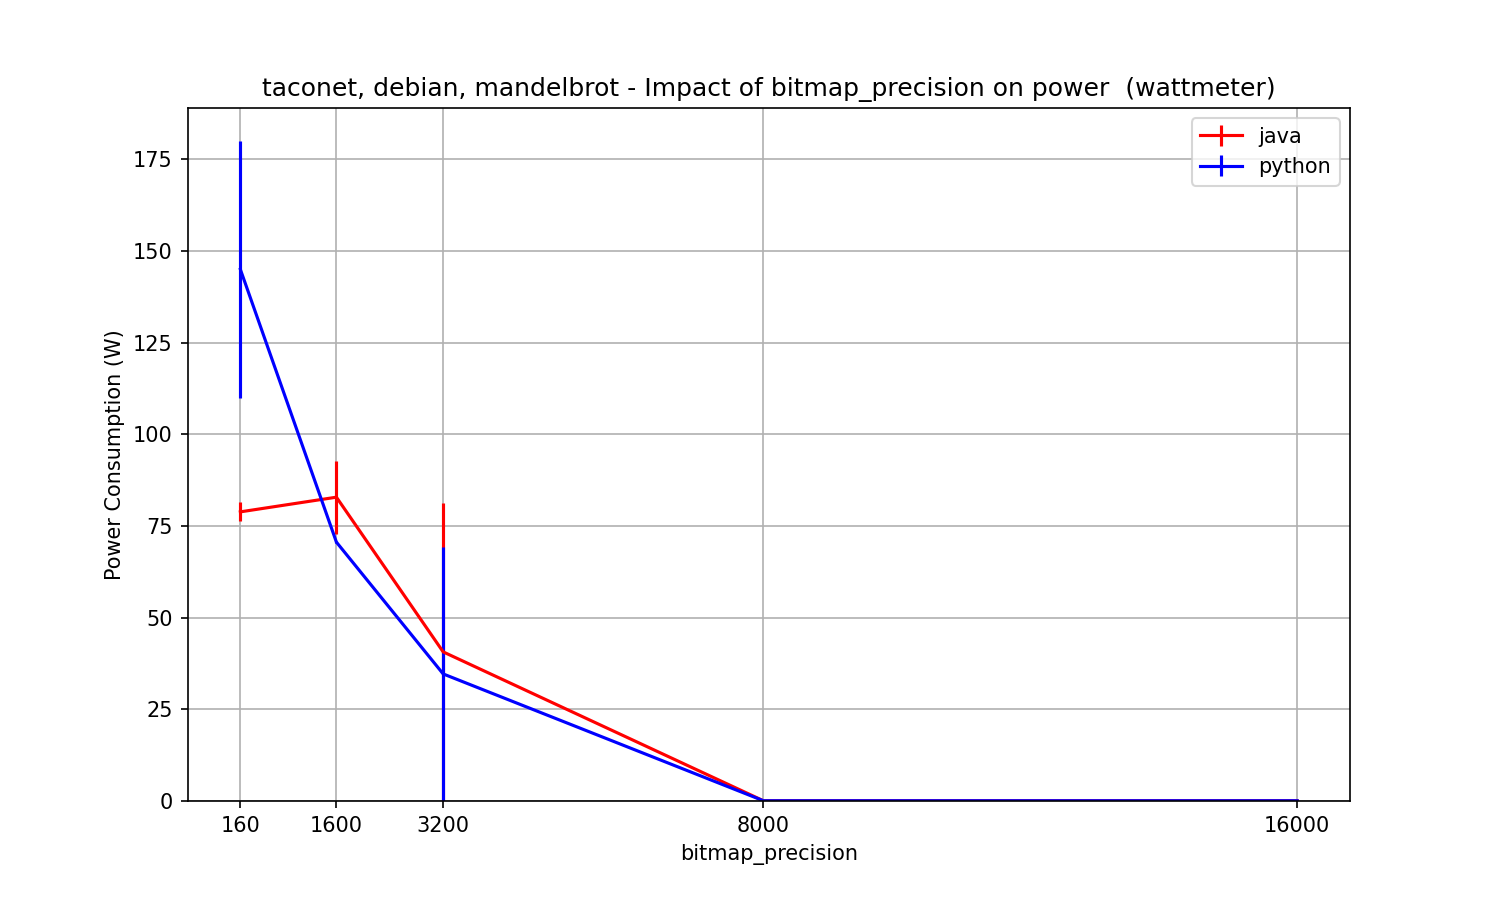
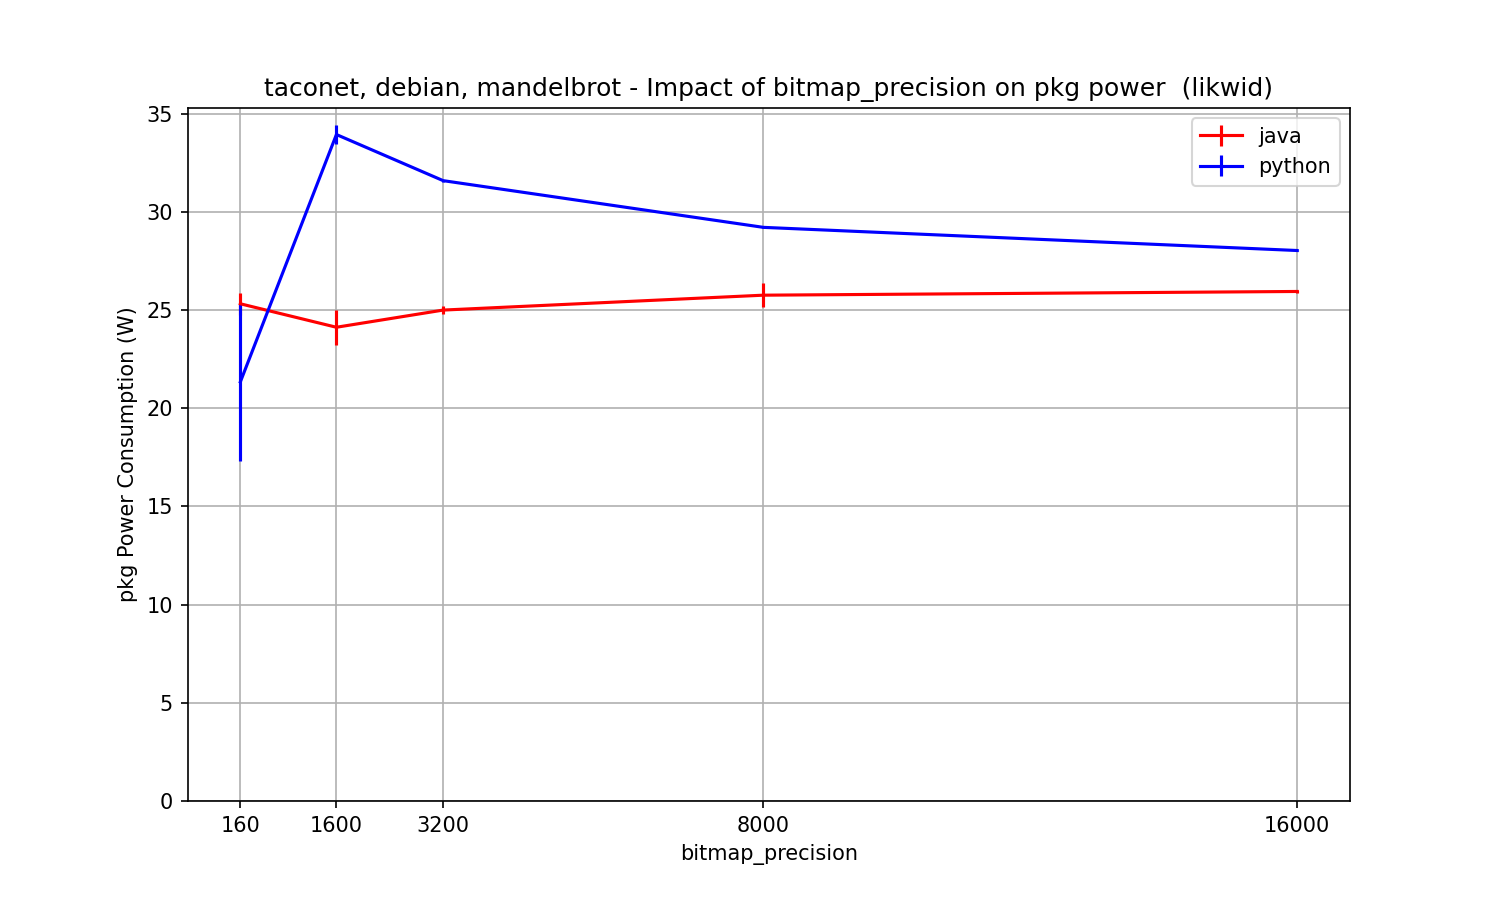
It can be seen that the power curve (pkg power) is more or less constant. However, we can notice that for java, bitmap requires slightly more power according to its precision. Whereas for python we have a sudden increase between 160 and 1600 then a decrease of the power. It could be explained by the fact that the system decreases the frequency of the processor for reasons of over heats and as a result the power decreases and the execution time increases.
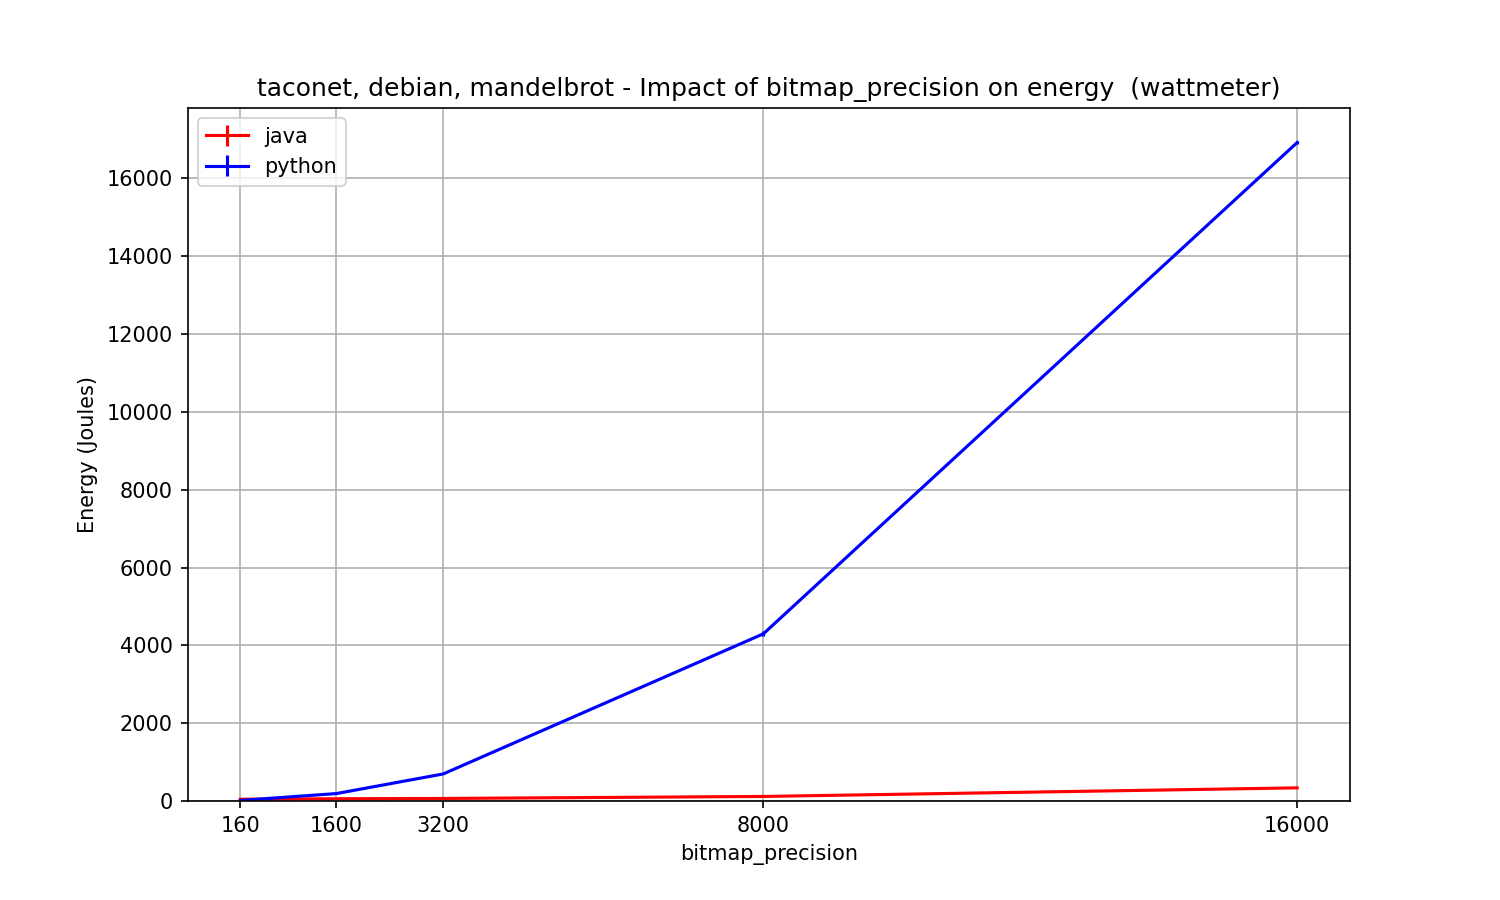
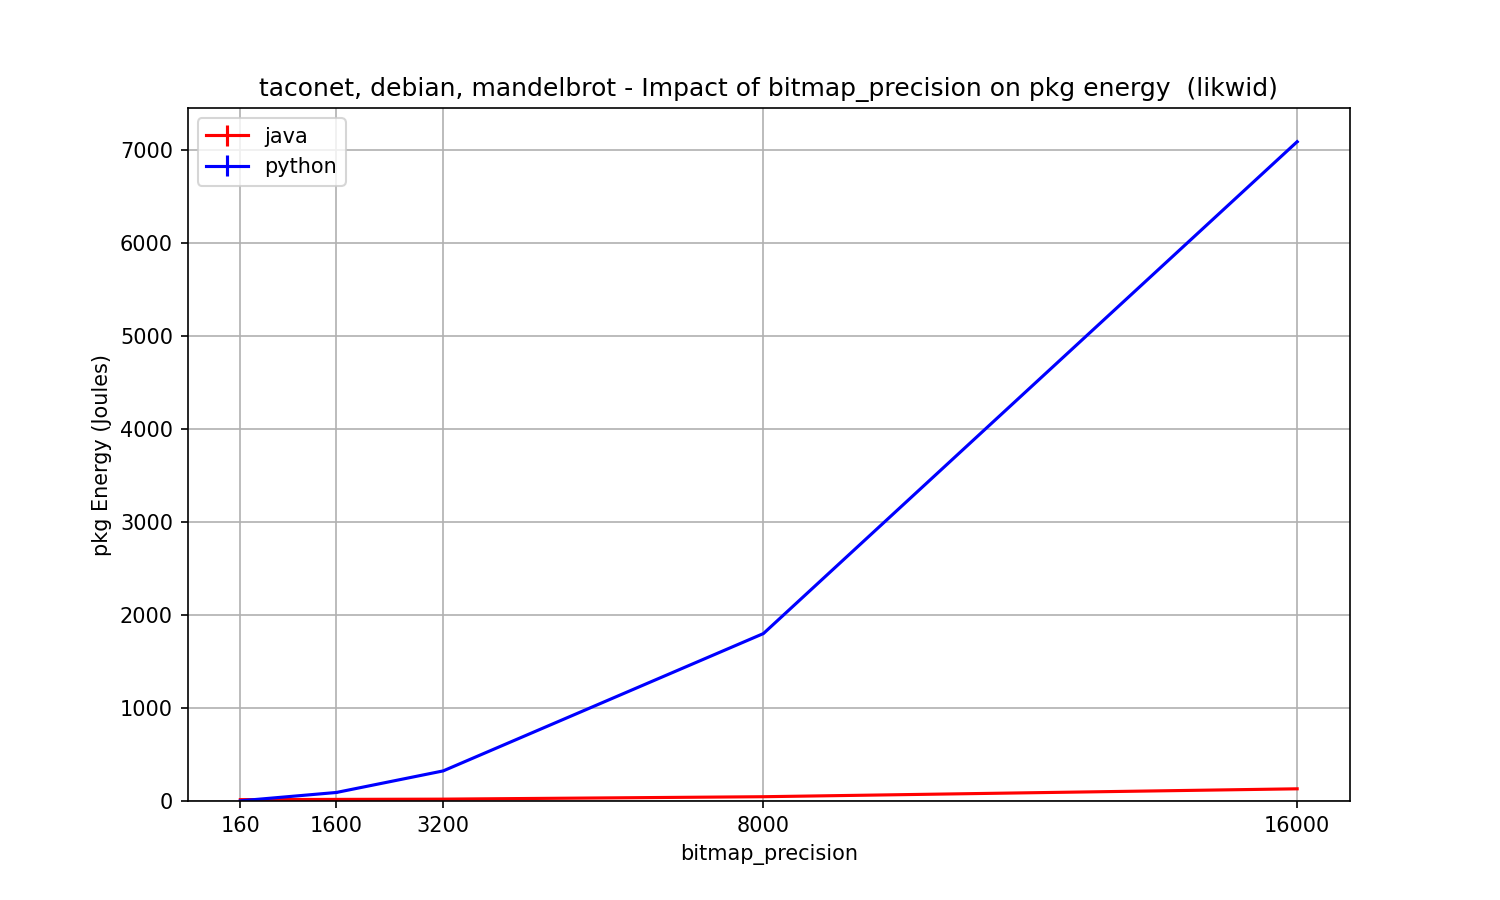
Which language is more energy consuming and why ?#
We can clearly see in Figures Wattmeter, mandelbrot energy and Likwid, pgk energy that the python language, which is an interpreted language, is more energy consuming. We advise to use interpreted language for small programs that are mainly used by yourself. For programs that are distributed on a larger scale, prefer a compiled language.
Questions about the differences Likwid/Wattmeter#
Do you obtain the same values in terms of time with the wattmeter and with likwid?#
If the measures were done on the same computer, we would have the same execution time with Likwid and Wattmeters. Those tools don’t add any execution time. Differences come from the models of computers (e.g., models recent computers may be more powerful than older ones, it also depends on the number of cores …).
Tip
You can see the model and description of the computers with hwloc-ls
and hwloc-ls -v
What are the differences between the measures obtained with the wattmeter and those obtained with likwid, analyze those differences.#
Do we have the same energy measure ? Why ?
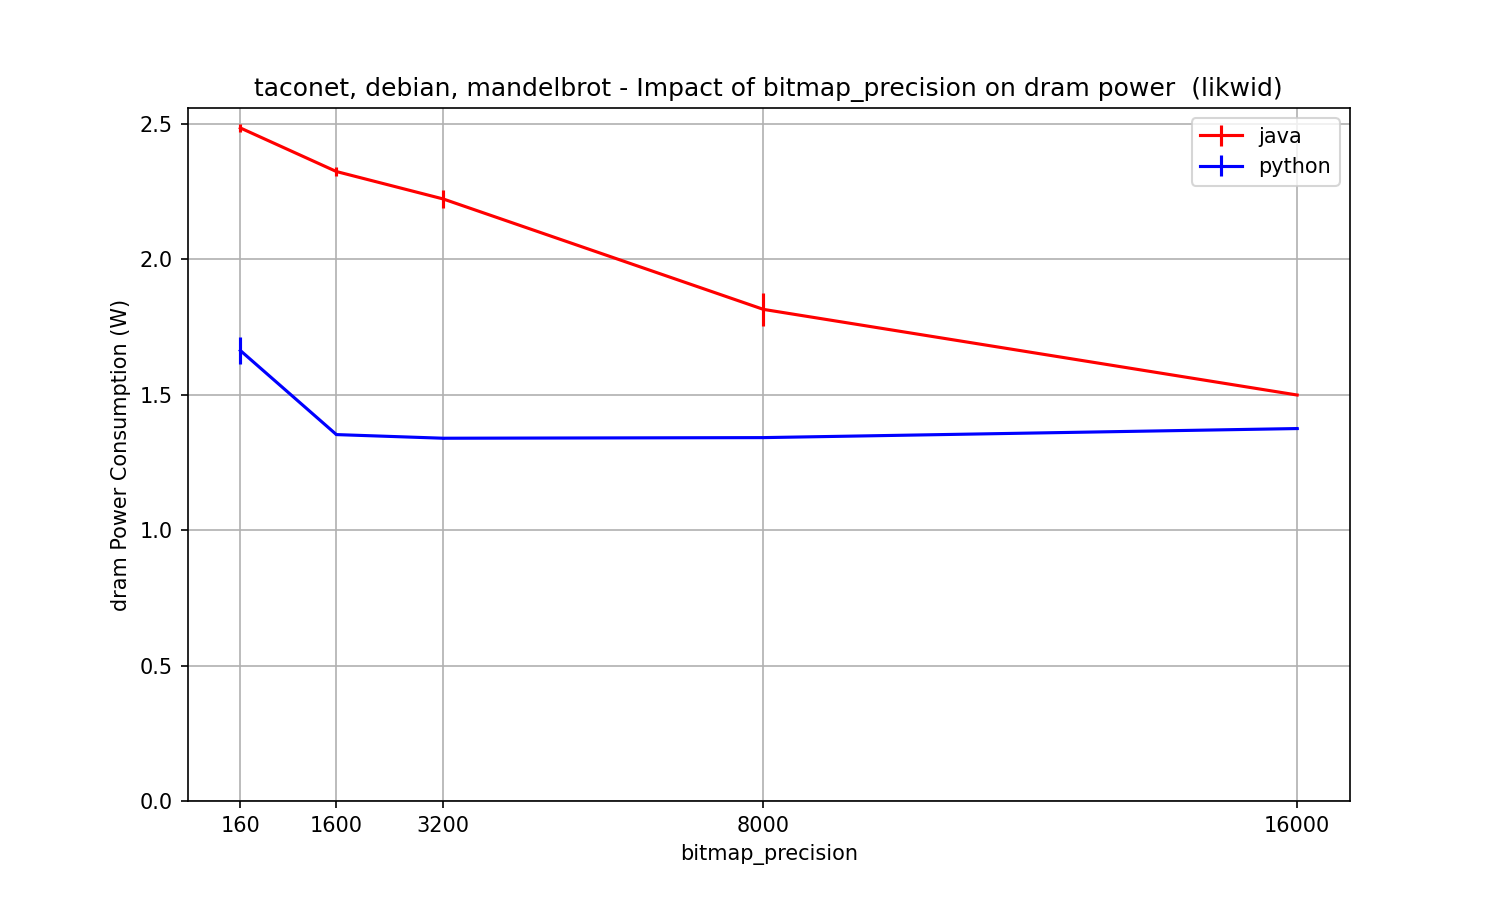
When they are executed on the same computers, we observe (see Figures Wattmeter, mandelbrot energy, Likwid, dram energy and Likwid, pgk energy) that the total cost with all the components is about 2 times more with the Wattmeter.
The main explanation is that the wattmeter measures the consumption of all the computer components, while likwid measures only the processor and memory components.
What we observe is in conformance with what is said in 2006Economou (cf. slides of the class “Measure” and the Figure of slide “Computer components and energy”)
“For example, more than 30-40% of the power is spent on the disk, the network, the I/O and peripherals, the power supplies, the regulators, and the rest of the glue circuitry in the server. Interestingly, only the disk and the power supply are single large contributors to this collection. At a component level, there are more than 30 other components that contribute to the remaining fraction of power in this category.”
2006-Economou : D. Economou, S. Rivoire, C. Kozyrakis, Full-system power analysis and modeling for server environments, in: In Workshop on Modeling Benchmarking and Simulation, 2006.
With Wattmeter and likwid, how do you isolate the energy consumption of one process or activity#
With wattmeter it is still impossible to isolate the consumption of one activity (one process, one application …) among other processes and operating system activities. One option to do that, is to measure the energy consumption while the computer does the minimum (idle) and to substract the measure while activity and the measure while idle : \(E_{process}=E_{total}-E_{idle}\)
With Likwid, if we are on a multi processor computer we could ask to reserve a processor for a given process (we did not do that during the lab).
Sampling rate with likwid and with Yocto-watt#
The power sampling rate is important for accurate results
With RAPL and Likwid the sampling rate is about 1000 Hz
With the Yocto-Watt the sampling rate is about 600 Hz (the refresh rate is of 10Hz)
Which tool is easiest to use ?#
Programming API#
Likwid and Wattmeter both have a software API, that is important to get the measures easily. Be careful when you choose a tool to think to the possibility to automate measurements with software APIs.
The Yocto-Watt API is available in more than ten languages (among them C, Java, sh, python, php, C#).
The Likwid API is available in C, shell, java and Python.
Availability of the tool on your computer#
You can plug a Wattmeter to any kind of device, you can then measure the power consumption of any device. But … you have to plug the wattmeter, that is to say every computer does not offer the possibility to measure.
RAPL/Likwid is only available on some kind of computers. RAPL works for some Intel microarchitectures (Skylake, Haswell, Sandy Bridge, Sandy Bridge_ep (Server) and Ivy Bridge), find here the Likwid supported architectures.
For now on the availability of tools have to be verified for each infrastructure. We can forecast that because of the importance of the subject, more and more software tools will be available in the future.
Software Carbon intensity#
Formula : \(SCI=(E \times I)+ M ~~per ~~R\)
R is the functional unit, i.e. one execution of the mandelbrot program for precision 16000 in java and python
E is the energy in KWh : the results you have in the labs are in Joule, you have to multiply by 0.000000278 to have it in KWh for our results
Details for the conversion from Joule to KWh: 3600 seconds for one hour; 1000 Wh for one Wh; \(0.000000278 = 1/(3600 \times 1000)\)
For the results shown in Figures Wattmeter, mandelbrot energy :
\(E_{java}=345 J\)
\(E_{python}16880 J\)
I is the value of \(gCO_{2}eq /KWh\) which is of \(43gCO_{2}eq\) in France (we have taken the mean for the last 12 month in France according to electricity map)
\(E\times I\)
\(E_{java}\times I=345*0.000000278*43=0,00412413gCO_{2}eq\)
\(E_{python}\times I=16880*0.000000278*43=0,20178352gCO_{2}eq\)
\(M\) is the embodied carbon impact of your computer for one execution of this functional unit, we give an estimation below considering
The time the computer is available during his lifetime, \(D_{Lifetime}\)
The duration of the functional unit: \(D_{R_{java}}=5.059000 s\) and \(D_{R_{python}}=253.427000 s\)
\(M_{Total}=500~000g\) for the production of the computer (according to boavitza)
For \(D_{Lifetime}\), we have considered that
The lifetime of the computer is 3 years
The lab is available during the working day only (32 weeks a year, 5 days a week, 10 hours a day)
\(D_{Lifetime}=3 \times 32 \times 5 \times 8 \times 3600 =17~280~000 seconds\)
\(M=M_{Total}\times D_{R}/D_{Lifetime}\)
\(M_{R_{java}}=500~000 \times 5.059000 /17~280~000=0,146383102gCO_{2}eq\)
\(M_{R_{python}}=500~000 \times 253.427000 /17~280~000=7,332957176gCO_{2}eq\)
Finally, we obtain this estimation:
\(SCI_{java}=0,00412413+0,146383102=0,150507232gCO_{2}eq/R_{java}\)
\(SCI_{python}=0,20178352+7,332957176=7,534740696gCO_{2}eq/R_{python}\)
We remark that in both case, M (impact of production) is bigger than E*I (impact of use).
Results on the computer b01-01#
Measures for the mandelbrot algorithm with the wattmeter (duration in seconds, energy in Joules, Power in W)#
| language | param | i | time | energy | power |
|---|---|---|---|---|---|
| java | 160 | 1 | 0.577000 | 47 | 81.455806 |
| java | 160 | 2 | 0.577000 | 44 | 76.256499 |
| java | 1600 | 1 | 0.700000 | 65 | 92.857143 |
| java | 1600 | 2 | 0.700000 | 51 | 72.857143 |
| java | 3200 | 1 | 0.800000 | 65 | 81.250000 |
| java | 3200 | 2 | 0.800000 | 65 | 81.250000 |
| java | 8000 | 1 | 1.745000 | 115 | 65.902579 |
| java | 8000 | 2 | 1.832000 | 119 | 64.956332 |
| java | 16000 | 1 | 5.054000 | 331 | 65.492679 |
| java | 16000 | 2 | 5.059000 | 345 | 68.195296 |
| python | 160 | 1 | 0.100000 | 18 | 180.000000 |
| python | 160 | 2 | 0.100000 | 11 | 110.000000 |
| python | 1600 | 1 | 2.718000 | 191 | 70.272259 |
| python | 1600 | 2 | 2.693000 | 191 | 70.924619 |
| python | 3200 | 1 | 10.080000 | 698 | 69.246032 |
| python | 3200 | 2 | 10.400000 | 692 | 66.538462 |
| python | 8000 | 1 | 61.600000 | 4363 | 70.827922 |
| python | 8000 | 2 | 61.700000 | 4230 | 68.557536 |
| python | 16000 | 1 | 252.700000 | 16960 | 67.115156 |
| python | 16000 | 2 | 253.427000 | 16880 | 66.606952 |
Measures for the mandelbrot algorithm with likwid (duration in seconds, energy in Joules, Power in W)#
| language | param | i | time | pkg | dram | pkg_power | dram_power |
|---|---|---|---|---|---|---|---|
| java | 160 | 1 | 0.577471 | 14.934900 | 1.443400 | 25.862593 | 2.499519 |
| java | 160 | 2 | 0.592812 | 14.681800 | 1.463300 | 24.766368 | 2.468405 |
| java | 1600 | 1 | 0.700169 | 17.511900 | 1.637800 | 25.010972 | 2.339151 |
| java | 1600 | 2 | 0.728798 | 16.928000 | 1.681400 | 23.227293 | 2.307087 |
| java | 3200 | 1 | 0.776617 | 19.568300 | 1.751800 | 25.196857 | 2.255682 |
| java | 3200 | 2 | 0.827324 | 20.509900 | 1.810300 | 24.790638 | 2.188138 |
| java | 8000 | 1 | 1.745333 | 43.862100 | 3.059900 | 25.131078 | 1.753190 |
| java | 8000 | 2 | 1.832350 | 48.325300 | 3.436800 | 26.373400 | 1.875624 |
| java | 16000 | 1 | 5.054968 | 131.432700 | 7.567000 | 26.000699 | 1.496943 |
| java | 16000 | 2 | 5.059344 | 130.942900 | 7.587400 | 25.881399 | 1.499681 |
| python | 160 | 1 | 0.076041 | 1.929700 | 0.130100 | 25.377163 | 1.710923 |
| python | 160 | 2 | 0.116653 | 2.017600 | 0.188300 | 17.295770 | 1.614192 |
| python | 1600 | 1 | 2.718186 | 90.886800 | 3.673800 | 33.436564 | 1.351563 |
| python | 1600 | 2 | 2.693637 | 92.729300 | 3.644500 | 34.425314 | 1.353003 |
| python | 3200 | 1 | 10.080870 | 317.938100 | 13.484900 | 31.538756 | 1.337672 |
| python | 3200 | 2 | 10.419160 | 329.531200 | 13.961600 | 31.627425 | 1.339993 |
| python | 8000 | 1 | 61.619270 | 1800.759800 | 82.590900 | 29.223972 | 1.340342 |
| python | 8000 | 2 | 61.745940 | 1802.113500 | 82.857800 | 29.185943 | 1.341915 |
| python | 16000 | 1 | 252.775100 | 7085.890800 | 347.047600 | 28.032392 | 1.372950 |
| python | 16000 | 2 | 253.427200 | 7100.993000 | 348.764200 | 28.019853 | 1.376191 |