
Numeric and energy consumption: Initiation lab#
Note
For this lab, you have to work on the lab room PCs. Wattmeters are installed on these PCs.
Objectives
In this lab, you will discover the question of the electricity consumption in numeric.
You will :
Look at introductory slides
Use of a wattmeter with a software API to measure the power and the energy of the computer.
Inject power measures to build a model that computes the power of a server with linear regression statistical learning method
To be able to reach those objectives in a reduce period of time, we provide you with some scripts in Python.
1 Introductory slides (15mn)#
2 Use of a Wattmeter (20mn)#
2.1 Initialisations#
The whole lab will be done in the $HOME/ENV4101/WattmeterLab directory. Create this directory and go to that directory.
mkdir -p $HOME/cen
cd $HOME/cen
Get the python scripts used in this lab
wget https://www-inf.telecom-sudparis.eu/COURS/cen/Mesures/tp-cen-semaine-recherche.zip
unzip tp-cen-semaine-recherche.zip
2.2 Connection and discovery of the Yocto-Watt#
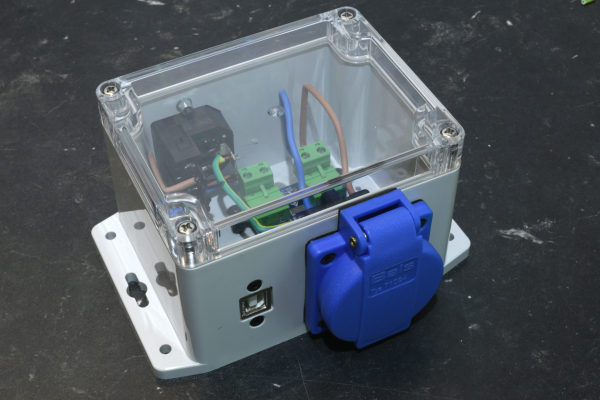
Fig. 1 Yocto Wattmeter#
Note
If you need, you can access the Yocto-Watt documentation
2.2.1 Connection of the Yocto-Watt#
The computer is plugged to the power supply through the wattmeter, which is then able to measure the energy consumption of the computer. The USB cable of the wattmeter is plugged to your computer and allows you to read the measures. The computer that reads the measures and the computer that is measured may be different.
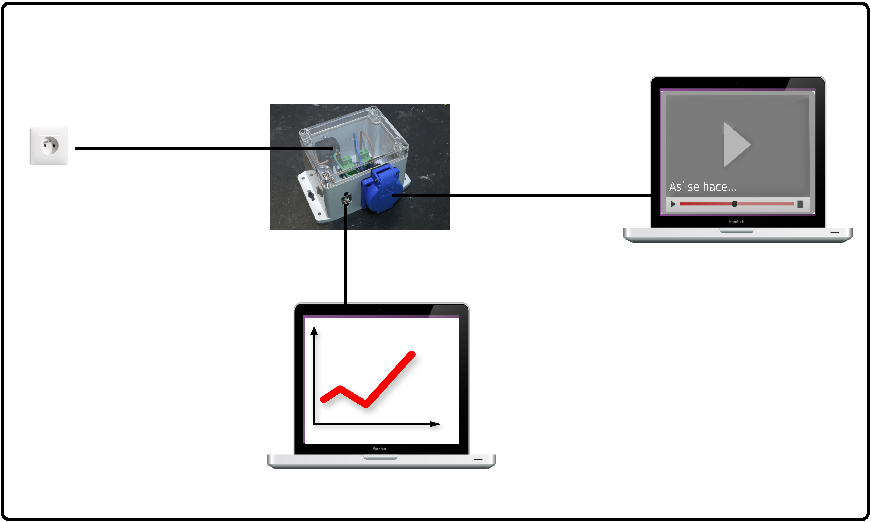
Fig. 2 Connection of the Yocto Wattmeter#
Check that the (blue) LED on the Yocto-Watt is on.
2.2.2 Discovering the Yocto Wattmeter through the VirtualHub#
The VirtualHub is a process that is already started on the computers of the lab room. It interacts with the Yocto-Wattmeter to provide the data read from the Wattmeter. It provides a web interface accessible on port 4444.
To access the VirtualHub, open a navigator and go to the URL http://localhost:4444/
Once the VirtualHub interface is open, click on the Yocto-Watt line, and read the following values:
Power
Energy
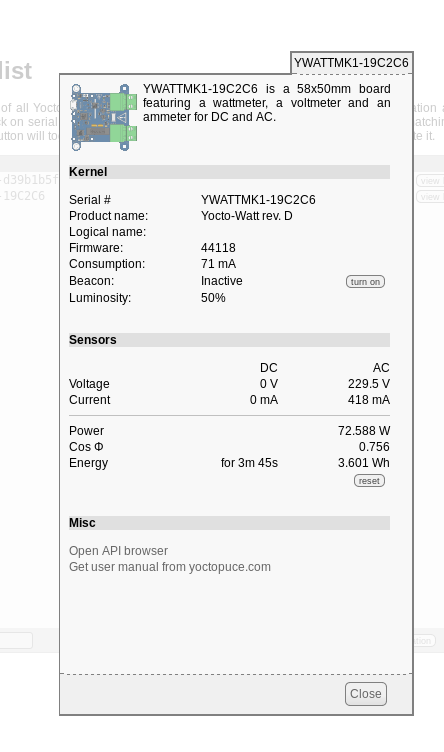
Fig. 3 Interface of the VirtualHub#
2.2.3Energy measure#
What do you notice ? What should you do to correctly measure the energy consumed by the computer during a given activity ?
Tip
Details
The power is not stable. It depends on the activity of the computer. It may impact the measures that you will realize.
As for any measure, you need to do the measures several times and calculate the mean and standard deviation.
In the interface, you have a reset button, to reset the energy consumption meter.
2.3 Idle state consumption#
Note
In this part you will have to close all the running applications before making the measurement.
You can now measure the idle state consumption of your computer using the python program measure_idle_state.py which you have downloaded before.
Explanation on the measure_idle_state.py script
This command takes two arguments: the number of measurements you want to perform and the duration of the measurement in seconds.
In this python script, the lines that interact with the Yocto-Watt are:
power = YPower.FirstPower()initiates the access to the Yocto-Watt data
Then there is a loop with the number of measurements to perform:
power.reset()resets the energy meter on the yocto-wattpower.get_meter()gets the energy meter from the yocto-watt in Wh (since the last reset)
Then it prints the mean and the standard deviation.
In order to test it quickly, run it for 3 measures of 2 seconds. The result of this command is the mean of the energy consumption in Joules for a period of 2 seconds.
python measure_idle_state.py 3 2
To have a slightly better estimation of the idle consumption, we will make 3 measures of 30 seconds.
python measure_idle_state.py 3 30
The results of the last command have been saved in the IDLE_state.csv file, it will be used in the next step of the lab. You can see it with
cat IDLE_state.csv
Bravo!
Congratulations, you have been able to perform a first evaluation of the energy consumption of your computer when it was “idle” for 30 seconds!
Remark
To have a better evaluation, we should stop more processes, and measure the energy consumption on a longer period.
If you want to have an idea on the number of processes that are running on your computer you can test those commands:
ps -u $USER # your processes
ps -u $USER |wc -l # the number of your running processes
ps -ax # all the processes
ps -ax|wc -l # the number of running processes
This computer is not your own computer, you can only stop the processes that you have started (such as navigators, editors). Be aware that they are a lot of daemons (processes that run forever), if it was your own computer you could limit the running processes to the strict minimum.
2.3 Online streaming and impact of video resolution#
Objectives
We will now study the energy consumption of the computer while watching online video. Our objective is to watch the same video for 30 seconds with various resolutions and see if there is an impact in terms of energy consumption.
If you are interested on the impact of the video on energy consumption, you can read this report from the Shift Project.
2.3.1 Measure the impact of video resolution with 3 common resolutions#
You will use this script
With this script, we:
Measure the energy consumed by the video for 30 seconds at 3 different resolutions: 360p, 720p and 1080p. Because we do not have much time, we only run each video once. For better estimation, we should obviously run more.
Substract the “Idle” measure you saved in IDLE_state.csv file
Plot a curve of the energy consumption according to the resolution. You will be asked for the name of the computer and the type of network.
Save the graphs in your working directory and show the resulting png on your computer. There are two graphs
the first one shows the total consumption of the computer
the second one shows the estimation of the consumption of streaming the video only (substracts the Idle consumption)
To run the command
First make sure that no process is started on your account (navigators, editors, …).
Then, run the following command.This script launches the view of a 30 seconds long video, 3 times, each time with a different resolution. Just be patient and let the videos run, threee times, before analyzing the results.
sh watch_online_video_simple.sh
2.3.2 Analyse the results#
Comment on the impact you observe of the video resolution on the power consumption of your computer.
Imagine the impact of higher resolutions such as:
Two high resolution formats:
HD (high resolution 720p): 1 280 pixels per row × 720 rows (the last we have used)
Full HD (1080p ou 1080i): 1 920 × 1 080, or approximately 2 million pixels per image.
Two very high definition formats
UHD (ultra high definition): 3 840 × 2 160, 4 times more pixels than in Full HD. This 16:9 format is particularly suitable for watching movies on a television;
4K: 4 096 × 2 160, little more than UHD with a cinema format.
Bravo!
Congratulations, you have been able to comment on the impact of video resolution on energy consumption!
In the future, we advise you to choose a sober and appropriate resolution while looking at your favorite videos!
3. Inject power measures to build a model (20mn)#
In this part of the lab, we will use power measures to build a model that computes the power of a server. To build this model, you will use a linear regression statistical learning method
For this part of the lab we use jupyter-lab.
Start jupyter-lab
jupyter-lab &
If not already opened, open a navigator and go to the URL : http://localhost:8888/
firefox http://localhost:8888/ &
From the navigator notebook page, load the file NoteBookRegression.ipynb which was on the zip file and follow the instructions.