
Dicover JoularJX lab: some elements on the questions you had to answer during the lab#
Experimental conditions
The results shown here have been obtained with a HP EliteBook laptop. You can obtain different results on the computer with which you have done the experiments.
NB We don’t mention the number of iterations of the experiments, indeed what we look in the results is more the comparison of the consumption among methods than the consumption values themselves.
RayCasting part questions#
Why do you think the contains method does not appear on the graph or in the csv files?#
We can see in Figure RayCasting without filtering that the contains method does not appear
NB: It is often the case, but some times a low value is obtained for the contains method. It may depends from one execution to the other. Sometimes contains may appear at the top of the stack trace. When this method appears in the graph, it is with a low consumption value (compared to other methods).
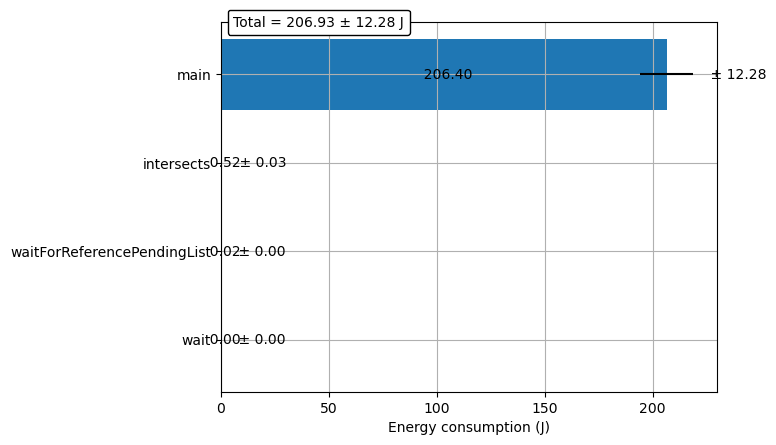
RayCasting without filtering#
In general the methods that do not appear on the graph are the methods that have a duration too low to be detected by the JoularJX monitoring loop. This loop gets the method at the top of the stack trace every 10ms. It may happen that a method is never the first one in the stack trace at monitoring instants. It is the reason why, some methods do not appear in the graph.
Methods filtered (RayCasting class); print in intersect is uncommented. Comment why the two graphs show different values for the intersects method?#
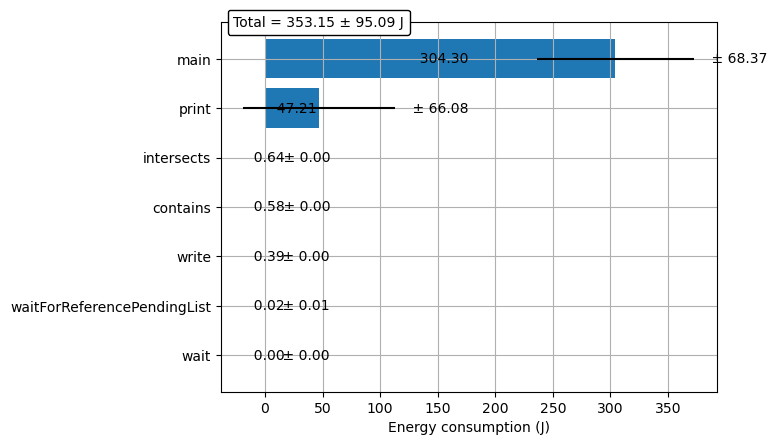
RayCasting with filtering all methods#
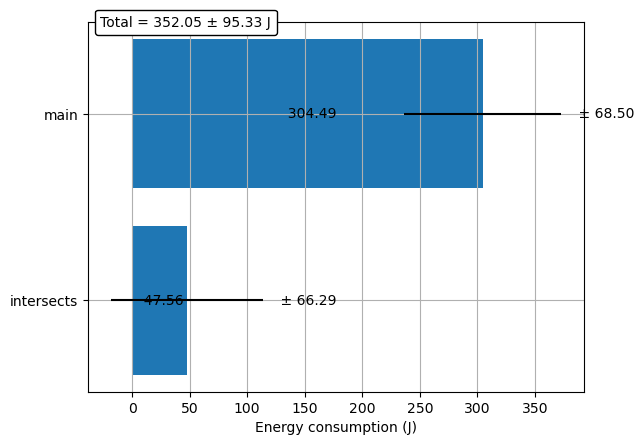
RayCasting with filtering only filtered methods#
For each graph, the method consumption is counted for only one method.
In the case of the non filtered graph, it is counted for the active method only (the one at the top of the stack trace).
In the case of the filtered graph, it is counted for the first filtered and active method encountered in the stack trace.
In the RayCasting implementation, RayCasting.main calls RayCasting.contains that calls RayCasting.intersects that calls java.io.PrintStream.print
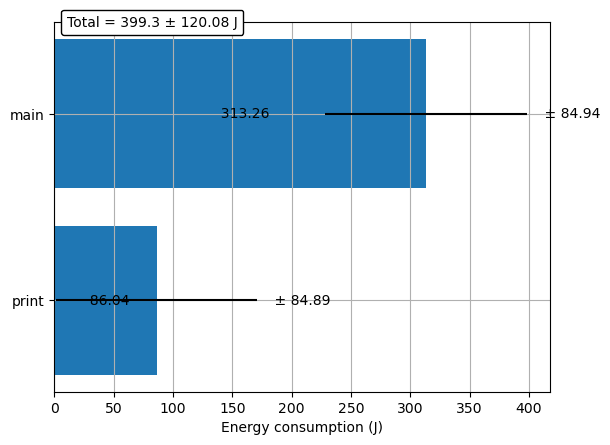
For the non filtered graph (figure RayCasting with filtering all methods): as soon as the jvm enters in the print method, the print becomes the first one in the stack trace, and the consumption is counted for the print method and not anymore for the intersects method.
For the filtered graph (figure RayCasting with filtering only filtered methods): Even if we enter in the print method, as the print method is not filtered it is still counted for the intersects method (the consumption is counted for the first FILTERED method encountered while browsing the stack trace from its top).
It is the reason why we have a higher value in the filtered graph for the intersects method.
After adding a filter for the java.io.PrintStream.print method, can you explain the differences ?#
NB We have found previously the java.io.PrintStream.print in the csv file : ./results/23.09.27-10h30m27s/all/joularJX-80498-all-methods-energy.csv
RayCasting.main,383.4313
sun.nio.cs.StreamEncoder.flushBuffer,0.6727
java.lang.ref.Reference.waitForReferencePendingList,0.0306
java.io.PrintStream.print,0.6727
It is the reason why this method has been added to the filtered methods.
If we add the method java.io.PrintStream.print to the filter, the consumption in the filtered graph that was attributed to intersects is now attributed to java.io.PrintStream.print as shown in figures RayCasting with filtering on the print, all methods and RayCasting with filtering on the print only filtered methods
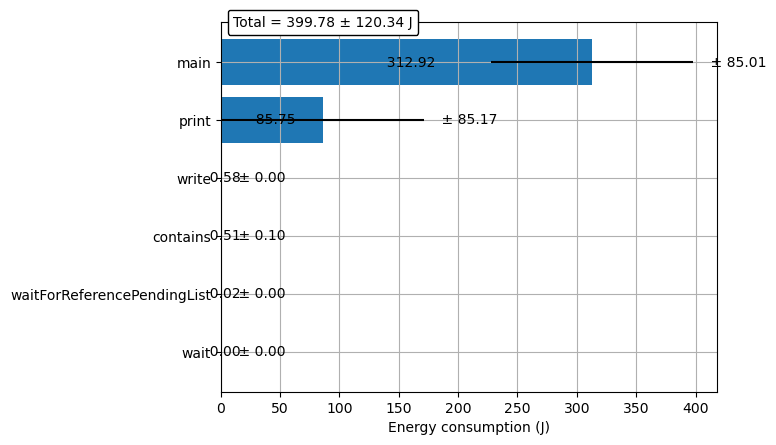
RayCasting with filtering on the print, all methods#
RayCasting with filtering on the print only filtered methods#
MeasureJavaCollection part#
Which of the package’s methods consumes the most energy? Please comment.#
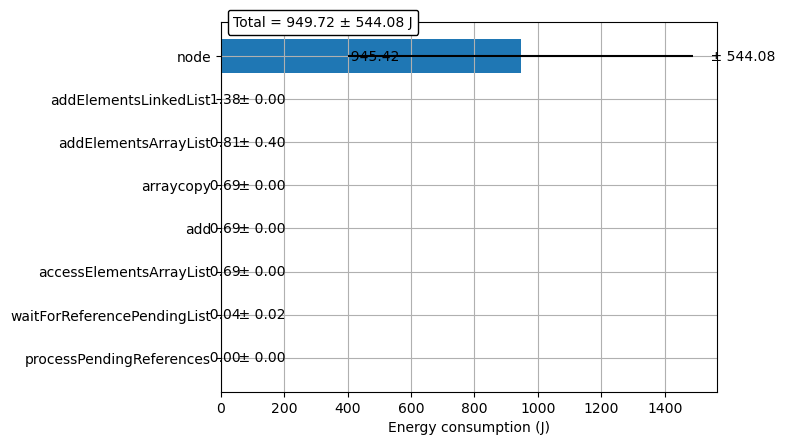
The figures Collections with filtering on the packages method all and Collections with filtering on the packages, filtered methods show the results obtained with a filtering on all the package measureJavaCollections methods.
Collections with filtering on the packages method all#
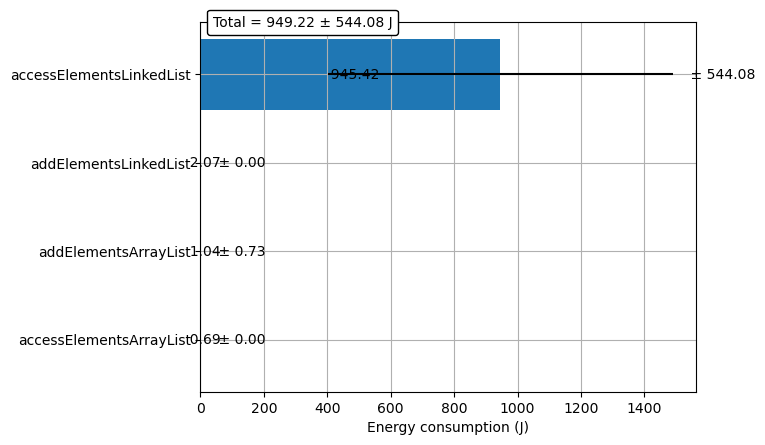
Collections with filtering on the packages, filtered methods#
On the graphs, we clearly see that the package most consuming method is: accessElementsLinkedList. The reason is that the linked list requires access to its nodes through sequential traversal of all the nodes till the indexed one.
We can see in the Collections with filtering on the packages method all figure that the most consuming method out of the package it is the method java.util.LinkedList.node that is not public and not described in the LinkedList (Java Doc).
Collection comparison#
What is the hierarchy of the most consuming methods among the 6 methods
“add
nelements” at the end of the collection (addElementsLinkedList,addElementsArrayList),“access
nelements” with their index (accessElementsLinkedList,accessElementsArrayList), and finally“remove
nelements” taken at the end of the collection (removeElementsLinkedList,removeElementsArrayList). Please comment.
From previous questions, we already know that accessElementsLinkedList is the most
consuming method.
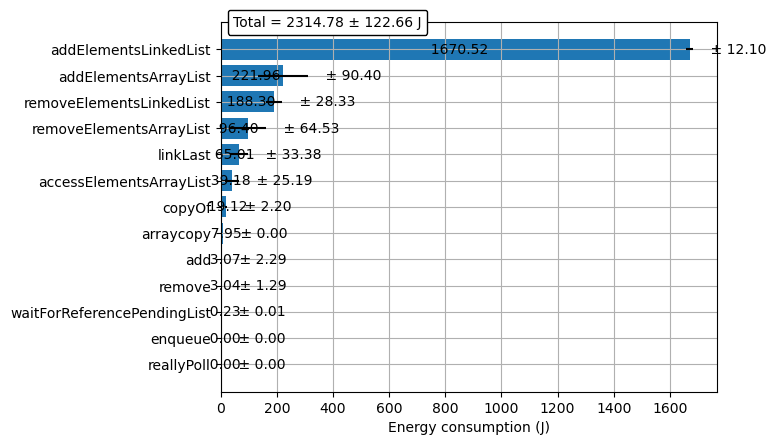
To be able to answer to the hierarchy question, in the code, we comment the line concerning the method accessElementsLinkedList.
Then we obtain the following graphs
Collections with filtering on the packages method all (without accessElementsLinkedList)#
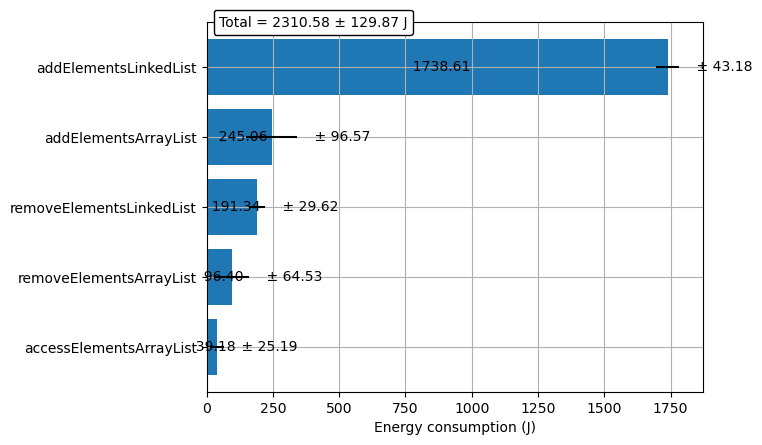
Collections with filtering on the packages method, filtered methods (without accessElementsLinkedList)#
With graphs Collections with filtering on the packages, filtered methods and Collections with filtering on the packages method, filtered methods (without accessElementsLinkedList) we are able to build a hierarchy of the most consuming methods in the package:
accessElementsLinkedListaddElementsLinkedListaddElementsArrayListremoveElementsLinkedListremoveElementsArrayListaccessElementsArrayList
Keep in mind that the results could have been different if we had chosen to “add n elements” at the beginning of the collection
or to “remove n elements” at the beginning of the collection.
The general rules are
We should choose LinkedList when operations like data addition or deletion occur more frequently than reading the data.
Conversely, use ArrayList when data reading scenarios are more common than adding or removing data. This is because ArrayList is better equipped for frequent data retrievals.
You can find some more information ArrayList vs LinkedList and energy consumption for ArrayList, LinkedList and Vector