CSC 5001– High Performance Systems

Portail informatique

Performance analysis

Before starting, set up your environment.
The aim of this lab is to learn how to master different performance analysis tools. To do this, we'll analyze a toy application you can download here: mandelbrot.tgz.

Speedup plot

A first step in performance analysis is to evaluate the application's base performance. To do so, we're going to plot a speedup graph.
  1. Run the mandelbrot application while varying the number of OpenMP threads
  2. Create a .data file that contains:
    • First column: the number of threads;
    • Second column: the serial execution time;
    • Third column: the parallel execution time
    Here's an example of such file: SpeedUpMandelbrot-OpenMP.data.
  3. Examine and modify this Gnuplot file speedup.plot :
  4. Run the following command to generate a .png file:
  5. gnuplot speedup.plot
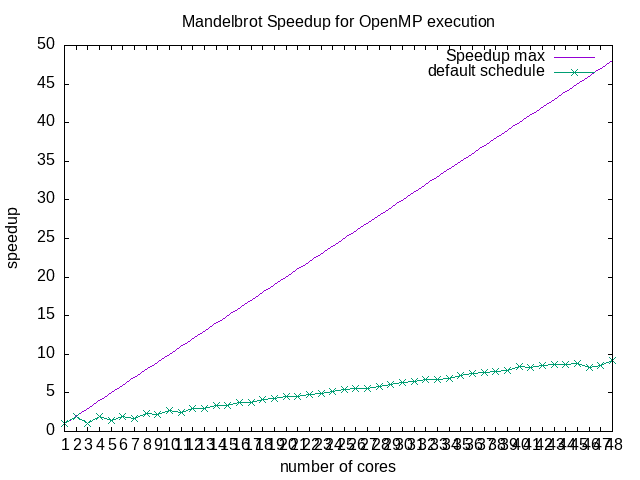
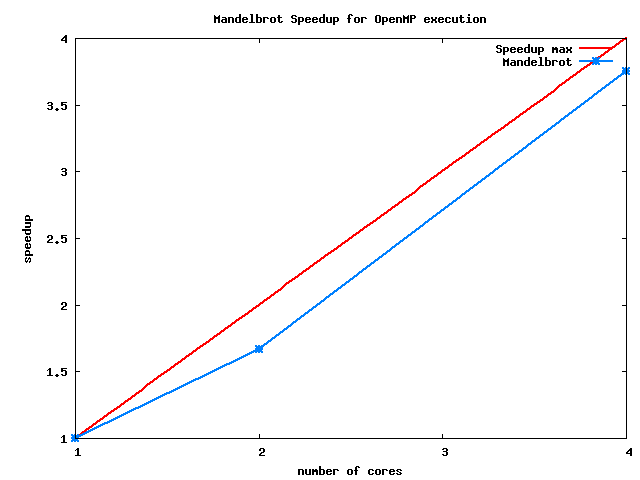
  6. Here's an example of output: SpeedUpMandelbrot-OpenMP.png.

To measure the performance, we can create a script file that runs the program, and generates the plot: run.sh.

Running the script on machine 3a401-13 gives the following performance measurement. By modifying the gnuplot script and running gnuplot speedup_v1.gp, we obtain the following speedup plot:

Profiling

Now, we need to determine the most time-consuming functions. To do that, run the application with perf record, and analyze the collected data with perf report.
$ perf record ./mandelbrot 10000 [...] [ perf record: Woken up 1 times to write data ] [ perf record: Captured and wrote 1,503 MB perf.data (39247 samples) ] $ perf report Samples: 39K of event 'cycles', Event count (approx.): 21327239393 Overhead Command Shared Object Symbol 97,19% mandelbrot mandelbrot [.] compute_pixel 1,14% mandelbrot libgomp.so.1.0.0 [.] 0x0000000000020600 0,85% mandelbrot libgomp.so.1.0.0 [.] 0x00000000000207b8 0,08% mandelbrot [unknown] [k] 0xffffffffb0d3ae24 0,06% mandelbrot libgomp.so.1.0.0 [.] 0x0000000000020602 0,04% mandelbrot libgomp.so.1.0.0 [.] 0x00000000000207ba 0,03% mandelbrot libgomp.so.1.0.0 [.] 0x000000000002060b 0,03% mandelbrot [unknown] [k] 0xffffffffb1a014cf 0,03% mandelbrot [unknown] [k] 0xffffffffb19ba7ab [...]

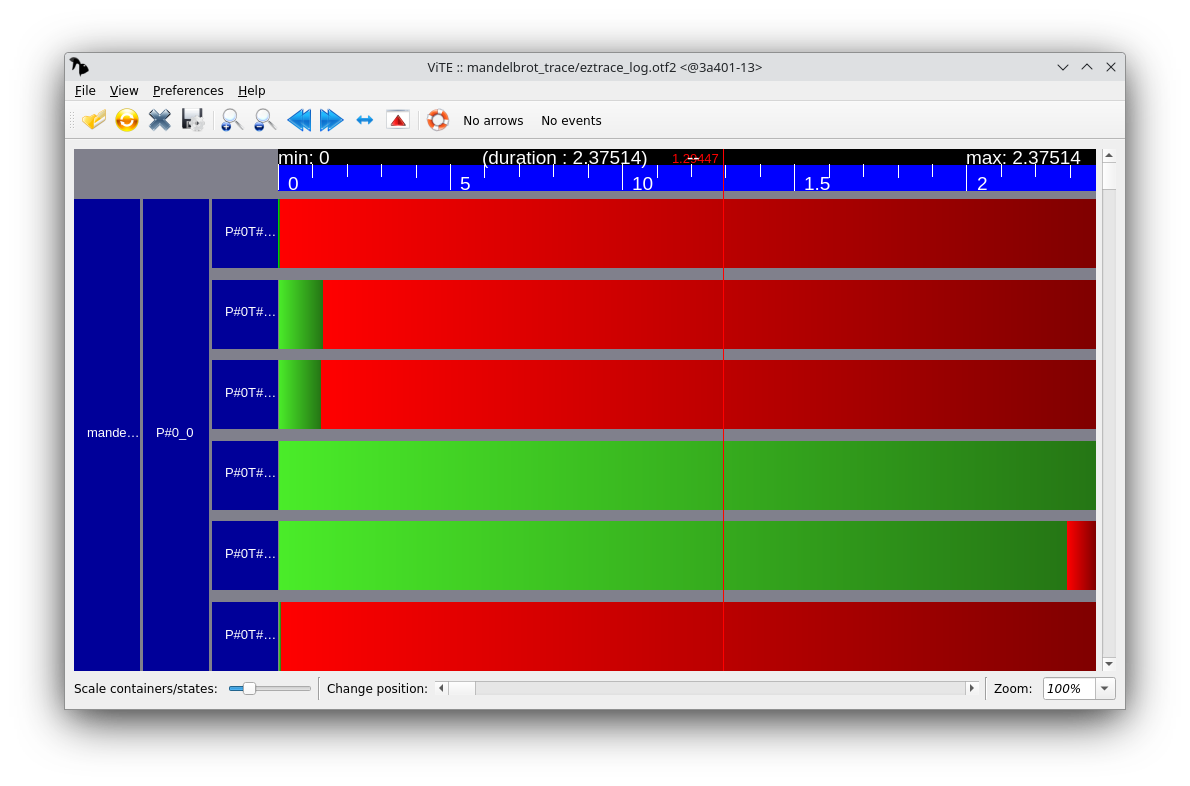
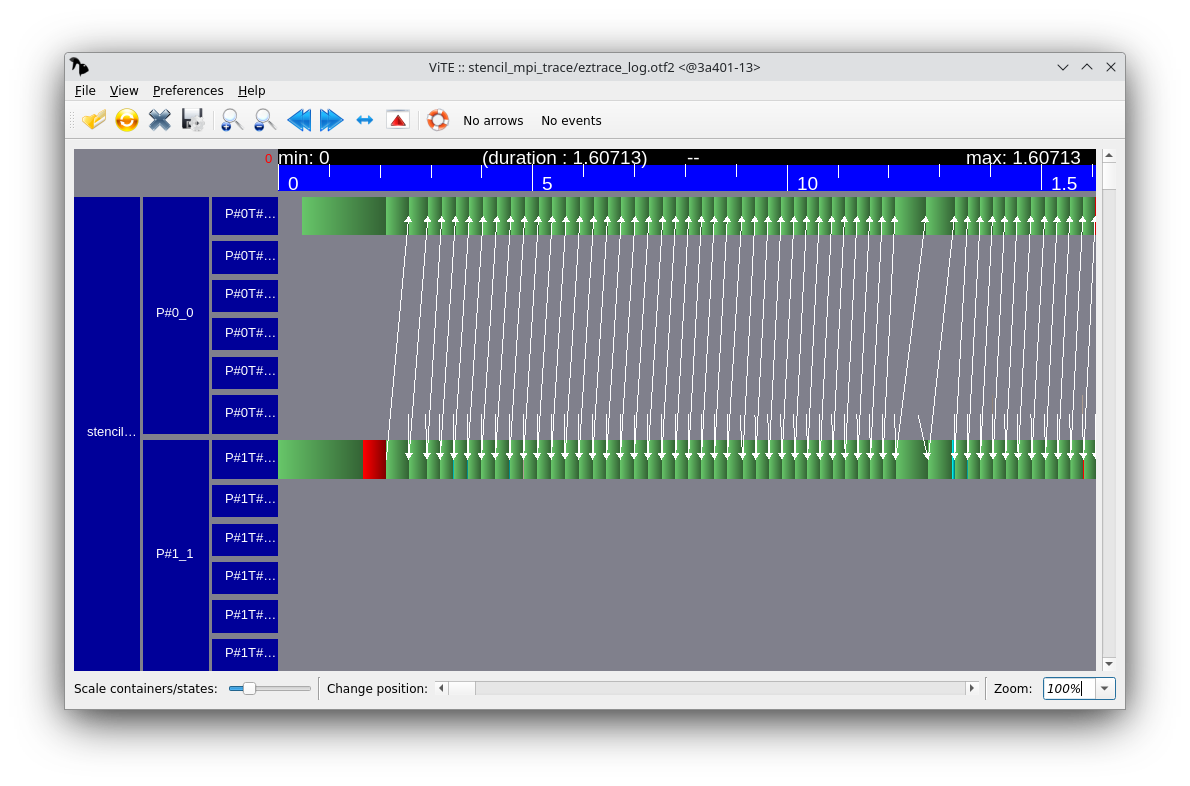
Tracing the execution of an OpenMP

The goal of this exercise is to generate an execution trace with EZTrace, and to visualize it with ViTE:
$ make clean $ make CC="eztrace_cc gcc" mandelbrot eztrace_cc gcc -fopenmp -o mandelbrot mandelbrot_seq.c $ eztrace -t openmp ./mandelbrot 10000 [...] Stopping EZTrace... saving trace $ vite mandelbrot_trace/eztrace_log.otf2
You can also compile the application with clang. This will use another OpenMP runtime system. In this case, you can use EZTrace's ompt plugin:
$ make clean $ make CC="clang" mandelbrot clang -fopenmp -o mandelbrot mandelbrot_seq.c $ eztrace -t ompt ./mandelbrot 10000 [...] Stopping EZTrace... saving trace $ vite mandelbrot_trace/eztrace_log.otf2

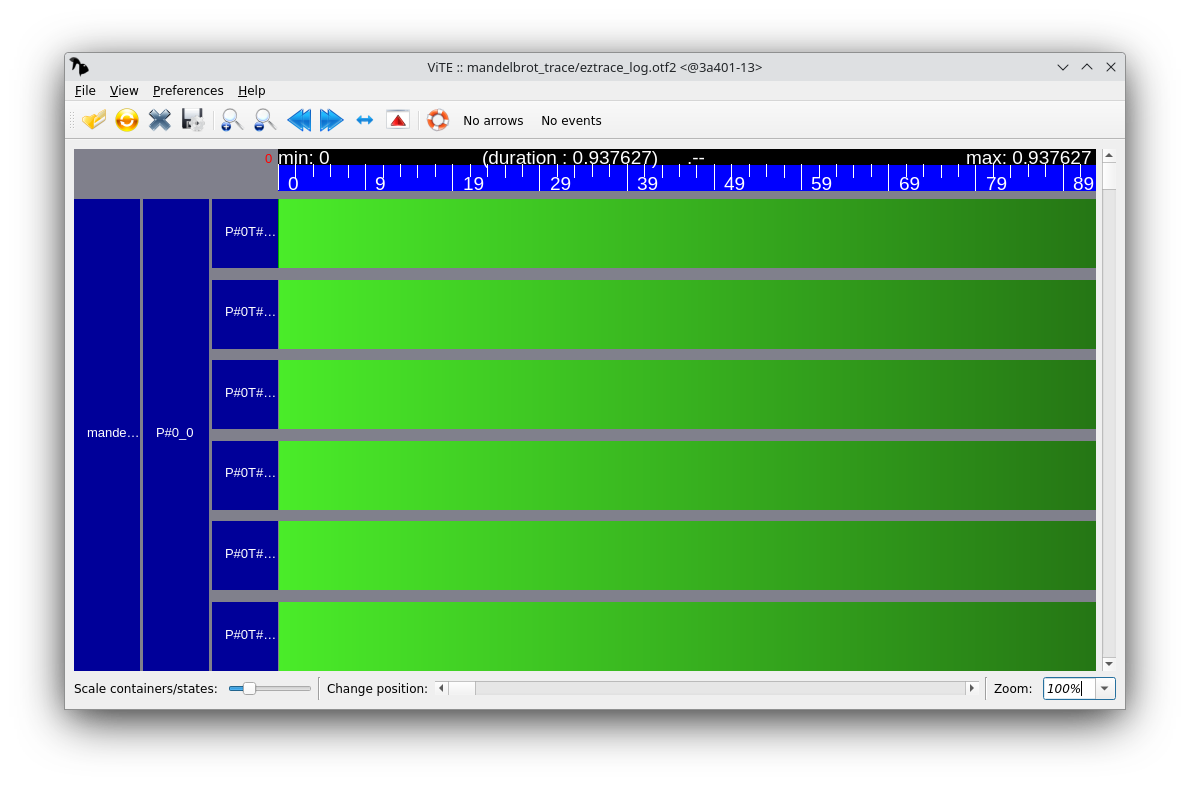
When visualizing the execution trace, you should see a load imbalance problem (this is the same problem as during the Parallel algorithmics lab). Fix this problem and generate another execution trace that shows that the load is balanced between threads.

$ make clean $ make CC="eztrace_cc gcc" mandelbrot eztrace_cc gcc mandelbrot_seq.c -o mandelbrot -fopenmp [eztrace_cc] Running: gcc /tmp/tmp.vfp8YHJPJl/mandelbrot_seq.c -o mandelbrot -fopenmp -I. -I/netfs/inf/trahay_f/opt/eztrace-2.1/include -I/netfs/inf/trahay_f/opt/opari2-2.0.6/include -leztpomp -L/netfs/inf/trahay_f/opt/eztrace-2.1/lib -Wl,-rpath=/netfs/inf/trahay_f/opt/eztrace-2.1/lib $ eztrace -t openmp ./mandelbrot 10000 [P0T0] Starting EZTrace (pid: 17832)... [P0T0] Intercepting all OpenMP constructs center = (0, 0), size = 2 maximum iterations = 10000 working time: 2.36977 s [P0T0] Stopping EZTrace (pid:17832)... $ vite mandelbrot_trace/eztrace_log.otf2

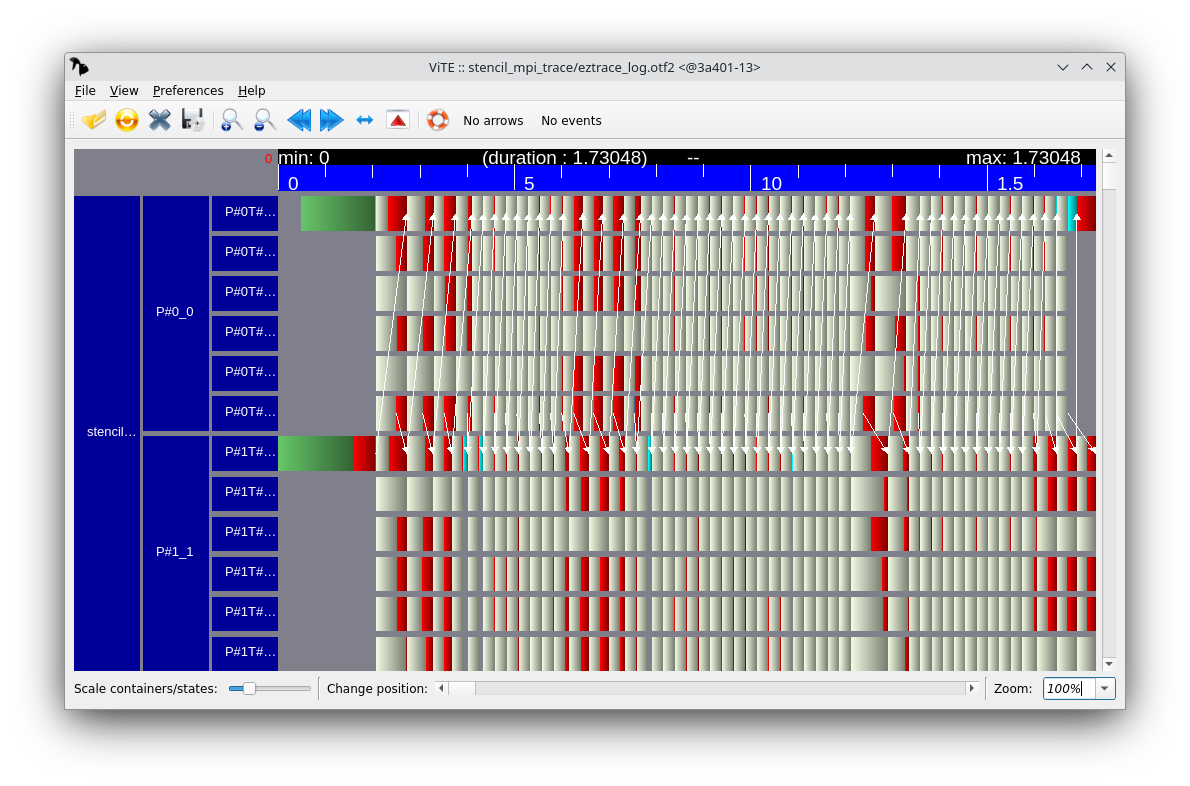
To fix the load imbalance problem, add a schedule(dynamic) directive to the #pragma omp parallel for directive:

[...] /* Calculate points and display */ #pragma omp parallel for private(row, col) schedule(dynamic) for (row = 0; row < height; ++row) { ulong couleur[width]; [...]
Running the application again gives:
$ make CC="eztrace_cc gcc" mandelbrot eztrace_cc gcc mandelbrot_seq.c -o mandelbrot -fopenmp [eztrace_cc] Running: gcc /tmp/tmp.vfp8YHJPJl/mandelbrot_seq.c -o mandelbrot -fopenmp -I. -I/netfs/inf/trahay_f/opt/eztrace-2.1/include -I/netfs/inf/trahay_f/opt/opari2-2.0.6/include -leztpomp -L/netfs/inf/trahay_f/opt/eztrace-2.1/lib -Wl,-rpath=/netfs/inf/trahay_f/opt/eztrace-2.1/lib $ eztrace -t openmp ./mandelbrot 10000 dir: mandelbrot_trace [P0T0] Starting EZTrace (pid: 18924)... [P0T0] Intercepting all OpenMP constructs center = (0, 0), size = 2 maximum iterations = 10000 working time: 0.937637 s [P0T0] Stopping EZTrace (pid:18924)... $ vite mandelbrot_trace/eztrace_log.otf2

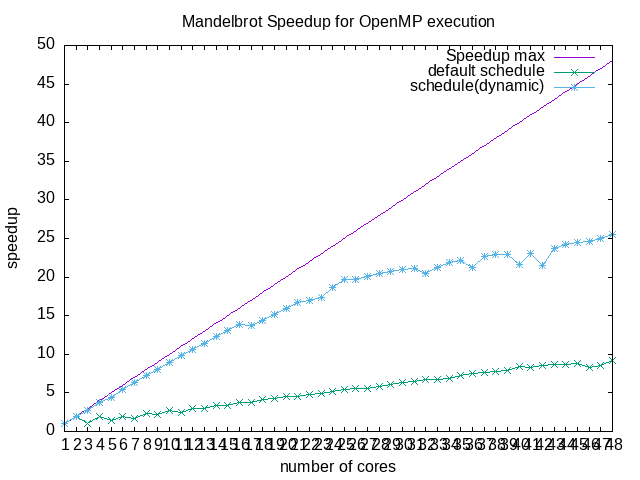
Now, run the performance measurement with a varying number of threads, and integrate the measured execution time to the speedup plot. The plot should include two lines: the original speedup plot, and the optimized speedup plot.

Let's run the run.sh script again. We obtain performance_v2.data. We modify the gnuplot script in order to plot several graphs at once: speedup_v2.gp. Running gnuplot speedup_v2.gp, gives the following speedup plot:

Tracing the execution of an MPI program

Download this program stencil_mpi.tgz and extract its files.

Use EZTrace to generate an execution trace of the program. To do that, EZTrace's mpi plugin.
$ make $ mpirun -np 2 eztrace -t mpi ./stencil_mpi [P1T0] Starting EZTrace (pid: 19450)... [P1T0] MPI mode selected [P0T0] Starting EZTrace (pid: 19449)... [P0T0] MPI mode selected Initialization (problem size: 4000) Start computing (50 steps) STEP 0... STEP 1... STEP 2... [...] STEP 48... STEP 49... 50 steps in 1.394494 sec (0.027890 sec/step) [P1T0] Stopping EZTrace (pid:19450)... [P0T0] Stopping EZTrace (pid:19449)... $ vite stencil_mpi_trace/eztrace_log.otf2

The stencil_mpi program mixes MPI and OpenMP. Use EZTrace to generate and execution trace that show both the MPI communication, and the OpenMP parallel regions.
$ make clean $ make CC="eztrace_cc mpicc" eztrace_cc mpicc -fopenmp -fopenmp stencil_mpi.c -o stencil_mpi [eztrace_cc] Running: mpicc -fopenmp -fopenmp /tmp/tmp.Vv1GSyzZfE/stencil_mpi.c -o stencil_mpi -I. -I/netfs/inf/trahay_f/opt/eztrace-2.1/include -I/netfs/inf/trahay_f/opt/opari2-2.0.6/include -leztpomp -L/netfs/inf/trahay_f/opt/eztrace-2.1/lib -Wl,-rpath=/netfs/inf/trahay_f/opt/eztrace-2.1/lib /tmp/tmp.Vv1GSyzZfE/stencil_mpi.c: In function ‘init’: /tmp/tmp.Vv1GSyzZfE/stencil_mpi.c:31:9: warning: implicit declaration of function ‘time’; did you mean ‘utimes’? [-Wimplicit-function-declaration] 31 | srand(time(NULL)); | ^~~~ | utimes $ mpirun -np 2 eztrace -t "mpi openmp" ./stencil_mpi $ mpirun -np 2 eztrace -t "mpi openmp" ./stencil_mpi [P0T0] Intercepting all OpenMP constructs [P0T0] Intercepting all OpenMP constructs [P1T0] Starting EZTrace (pid: 19756)... [P1T0] MPI mode selected Initialization (problem size: 4000) [P0T0] Starting EZTrace (pid: 19755)... [P0T0] MPI mode selected Start computing (50 steps) STEP 0... STEP 1... STEP 2... STEP 3... [...] STEP 48... STEP 49... 50 steps in 1.484796 sec (0.029696 sec/step) [P1T0] Stopping EZTrace (pid:19756)... [P0T0] Stopping EZTrace (pid:19755)... $ vite stencil_mpi_trace/eztrace_log.otf2

Project

Now that you now how to use several performance analysis tools, use them for your project !