In the overall of this section, a frequent activity threshold means the mimimum occurrence number of an activity that defines if it is frequent or not.
We selected here all the emails sent by the two employees E1 and E2 and we manually annotated the list of discussed activities. We ran then our algorithm to discover frequent activities of both employees. We used here two measures to evaluate each discovered activity :
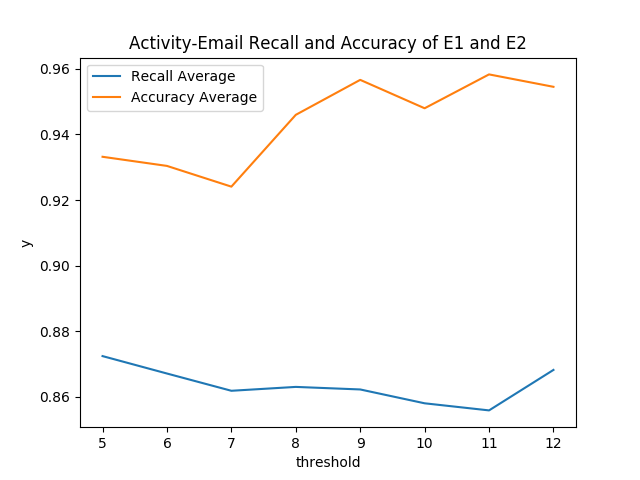
- Recall : it is the ratio of the correct detection to the total number of emails that actually contain an activity.
- Accuracy : it is the ratio of the correct detection to the total number of emails where an activity was discovered.
We calculate then the average of each measure. We varied the frequent activity threshold in the interval [5,12] to study the evolution of each average. Figure below shows this evolution. We can notice that the recall average and the accuracy average vary respectively in the following intervals [0.86, 0.88] and [0.92, 0.96] . This shows that our algorithm is able to detect relevant activities from emails with good recall (>= 0,86) and accuracy (>= 0,92). Additionally, the performances of such detection would be better by increasing the threshold of frequent activities (especially for accuracy performance). This validates one assumption that we suppose during our work : One employee executing frequent activities likely use close wordings to express them. By discovering the common substructures (patterns) characterizing such close wordings, activities can be recognized from emails.
We aim here to evaluate the relevance of the discovered activities, wich means the fraction of relevant activities among all the retreived activities. We extended the evaluation data set to the emails of 5 employees as the relevance metric does not require annotated emails. We ran our algorithm on the emails of each employee. Then, we annotated the obtained activities (relevant or not). We evaluated, for each employee and then for all employees, the evolution of the relevance metric value when varying the frequent activity threshold in the interval [5,12]. Figure below shows the obtained results.
Red curve in the figure shows the evolution of the relevance metric value considering the activities of all employees. Such value varies in the interval of [0.75,0.90]. It increases when increasing the frequent activity threshold. This result would validate another assumption in our work ; One employee executing frequent activities likely use close wordings to express them. This fact would bring a kind of regularity at the level of such wordings. This regularity would result in the appearance of frequent substructures (patterns) reflecting relevant activities. As consequence, patterns frequently shared would reflect relevant sub-structures characterizing activities, while what is shared at low frequency is likely to present noise (irrelevant information) (This is why the relevance ratio decreases when decreasing the threshold of frequent activities).
The other curves (E1, E2 , E3 , E4 , E5 ) show the evolution of the relevance metric value for each employee. We can notice that the slope of these curves is almost positive while its value varies from one employee to another . For instance, it is close to zero with E1, E2 and considerably increases with E5 . This can be explained by the variety of the job nature of these employees and the purpose to it they send their emails; E1 and E2 have regular activities and most often use their emails to introduce them. On the contray, E5 can send emails to discuss general topics in relation to Enron strategies (without introducing specific activities), which can inrease the appearance of random combination of words .