ls, cp, X,
gnome, etc.
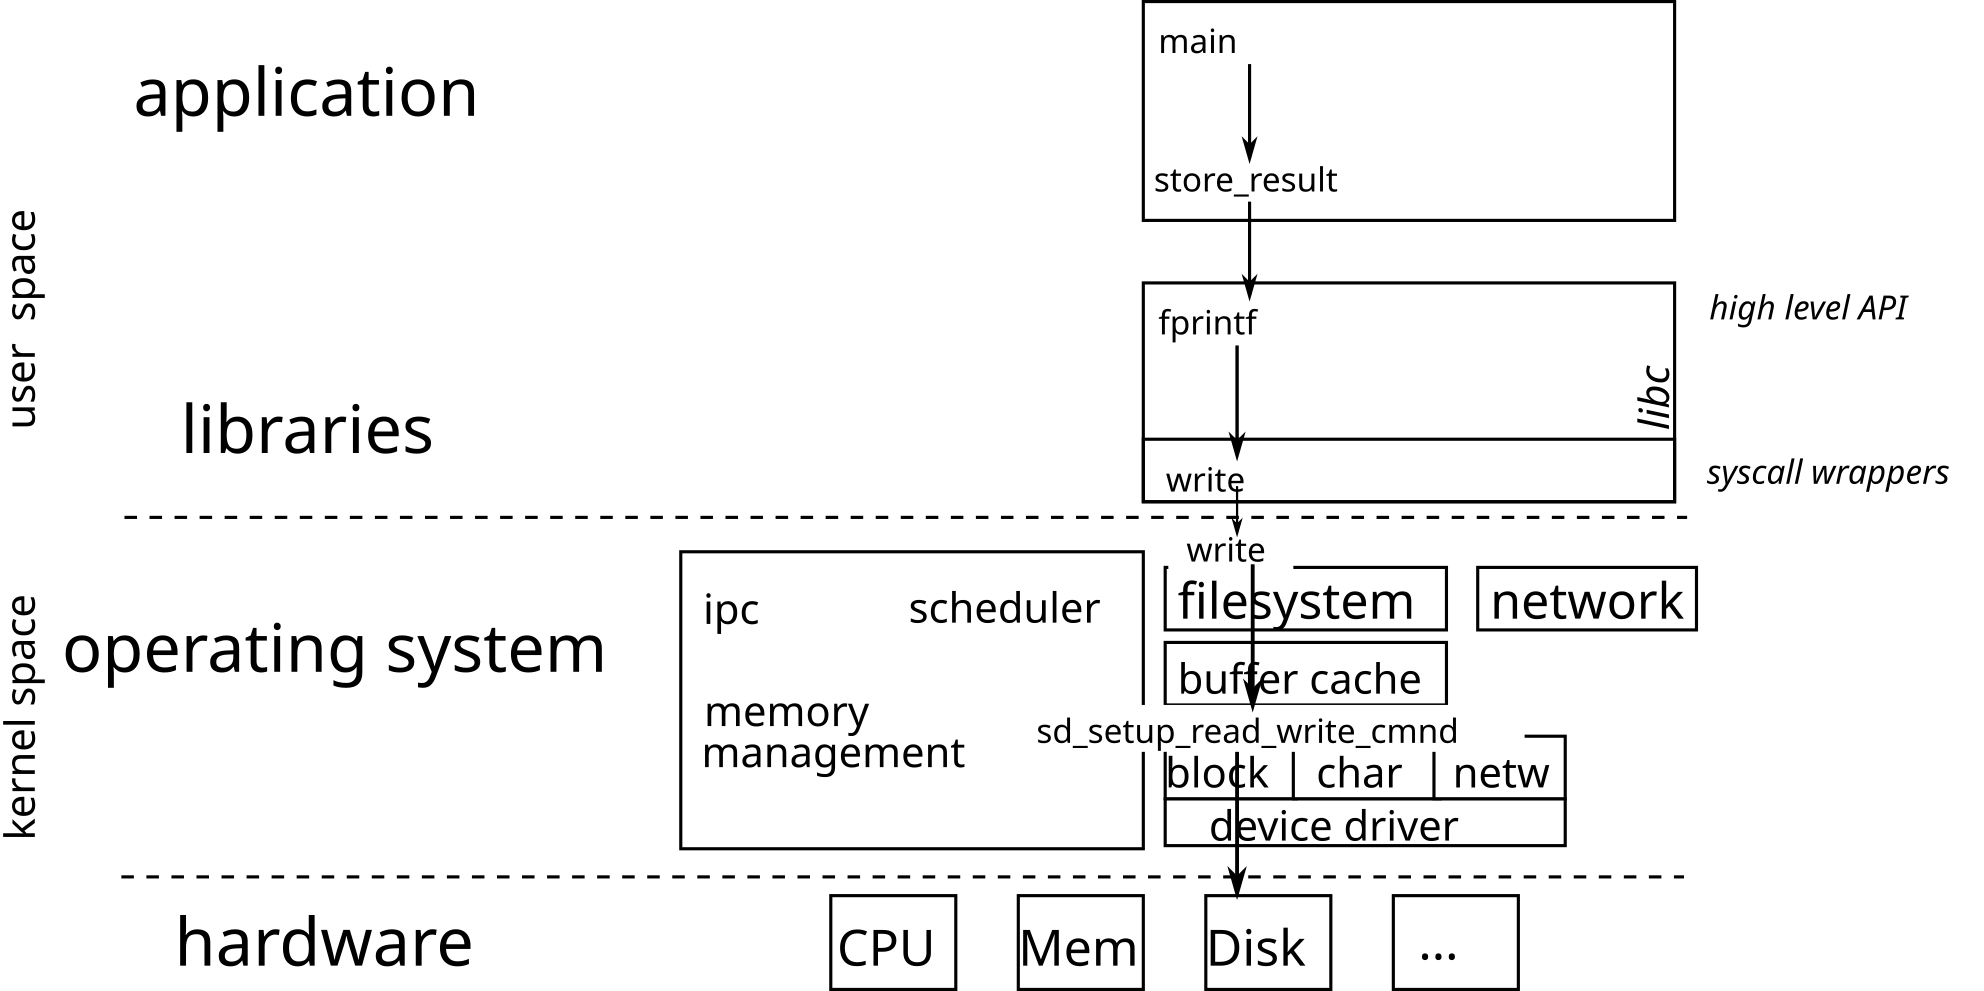
The operating system is responsible for operating various hardware. It, therefore, includes drivers capable of interacting with a particular material. The different drivers for the same type of peripheral offer the same interface, which allows the upper layers of the OS to use the hardware interchangeably.
The transition from user space to kernel space is done via a system
call (syscall). The kernel processes the request for the
application and returns a positive or zero integer on success, and
-1 on failure.
From the application point of view, system calls are exposed as
functions (defined in libc) in charge of executing the
system call.
You must always test the return value of a system call and deal with errors
Prevent the propagation of errors (the discovery of the error can take place much later)
see the fail-fast approach presented in CSC4102
errno: external variable indicating the cause of the
last error
The ERRORS section in a function manual describes
the possible causes of error.
Testimony of a former ASR student: “Without insistence from [the CSC4508 teachers], it would not have jumped out to us so quickly that the problems (in the robotics championship) came from a lack of errors handling on a code that had not been carefully proofread”.
The macro void assert (scalar expression) tests the
expression passed in parameter and, if false, displays a message error
and terminates the program (with the abort ()
function):
  struct stat buf;
  int rc = stat(file, &buf);
  assert(rc>=0);
  // -> in case of an error, prints:
  //   appli: appli.c:12: main: Assertion `rc>=0' failed.
  //   Abandon
However, the macro should be used with caution because it is disabled
when the program is compiled in optimized mode (with
gcc -O3 for example).
So it is better to test the return code, display a message describing the error, and possibly terminate the process.
struct stat buf;
int rc = stat(file, &buf);
if(rc < 0) {
  fprintf(stderr, "Error\n");
  exit(EXIT_FAILURE); // or abort();
}The errno.h file lists standard errors. The manual of
each system call (see man 2 function), and of each function
(man 3 function) indicates, in the ERRORS
section, the different error codes that may be returned.
The error message associated with a value of errno can
be obtained with strerror () or perror ():
struct stat buf;
int rc = stat(file, &buf);
if(rc < 0) {
  fprintf(stderr, "Error while accessing file '%s': %s\n", file, strerror());
  // -> message "Error while accessing file 'plop': No such file or directory"
  exit(EXIT_FAILURE);
}
or
struct stat buf;
int rc = stat(file, &buf);
if(rc < 0) {
  perror("Error while accessing file");
  // -> message: "Error while accessing file: No such file or directory"
  exit(EXIT_FAILURE);
}It is possible to define a macro displaying an error message and indicating where the error occurred. For example:
#define FATAL(errnum, ...) do {                               \
    fprintf(stderr, "Error in %s:%d:\n", __FILE__, __LINE__); \
    fprintf(stderr, __VA_ARGS__);                             \
    fprintf(stderr, ": %s\n", strerror(errnum));              \
    abort();                                                  \
  } while(0)

int main(int argc, char**argv) {
  char *file = argv[1];
  struct stat buf;
  int rc = stat(file, &buf);
  if(rc < 0) {
    FATAL(errno, "Cannot access file '%s'", file);
  }
  return EXIT_SUCCESS;
}
// affiche:
//  Error in fatal.c:21:
//  Cannot access file 'plop': No such file or directory
//  Abandon
When a program calls the abort () function in order to
terminate the process, a core dump file (that describes the
process when the error occured) can be generated in order to debug the
program with gdb.
To activate the generation of a core dump, run the command
ulimit -c unlimited. Therefore, the function
abort () generates a core dump which can be
supplied to gdb:
$ ./fatal  plop
Error in fatal.c:21:
Cannot access file 'plop': No such file or directory
Abandon (core dumped)

$ gdb ./fatal core
GNU gdb (Debian 8.1-4+b1) 8.1
[...]
Reading symbols from ./fatal...(no debugging symbols found)...done.
[New LWP 11589]
Core was generated by `./fatal plop'.
Program terminated with signal SIGABRT, Aborted.
#0  __GI_raise (sig=sig@entry=6) at ../sysdeps/unix/sysv/linux/raise.c:50
50      ../sysdeps/unix/sysv/linux/raise.c: Aucun fichier ou dossier de ce type.
(gdb) bt
#0  __GI_raise (sig=sig@entry=6) at ../sysdeps/unix/sysv/linux/raise.c:50
#1  0x00007ffff7dfb535 in __GI_abort () at abort.c:79
#2  0x0000555555555232 in main (argc=2, argv=0x7fffffffdcd8) at fatal.c:21
On Linux distribution running systemd, the core dumps are managed by
coredumpctl:
coredumpctl list prints the list of all the available
core dumpscoredumpctl info display basic information (such as the
command line that invoked the program, or the backtrace of the threads
when the crash occured) about the last core dump.coredumpctl debug invokes a debugger (eg.
gdb) on the last core dumpsp
register)rbp registersp to make space to save registers, and for
local variablesrarasp back to its previous valueraDepending on the CPU architecture (and sometimes the compiler), the way of making a function call may vary.
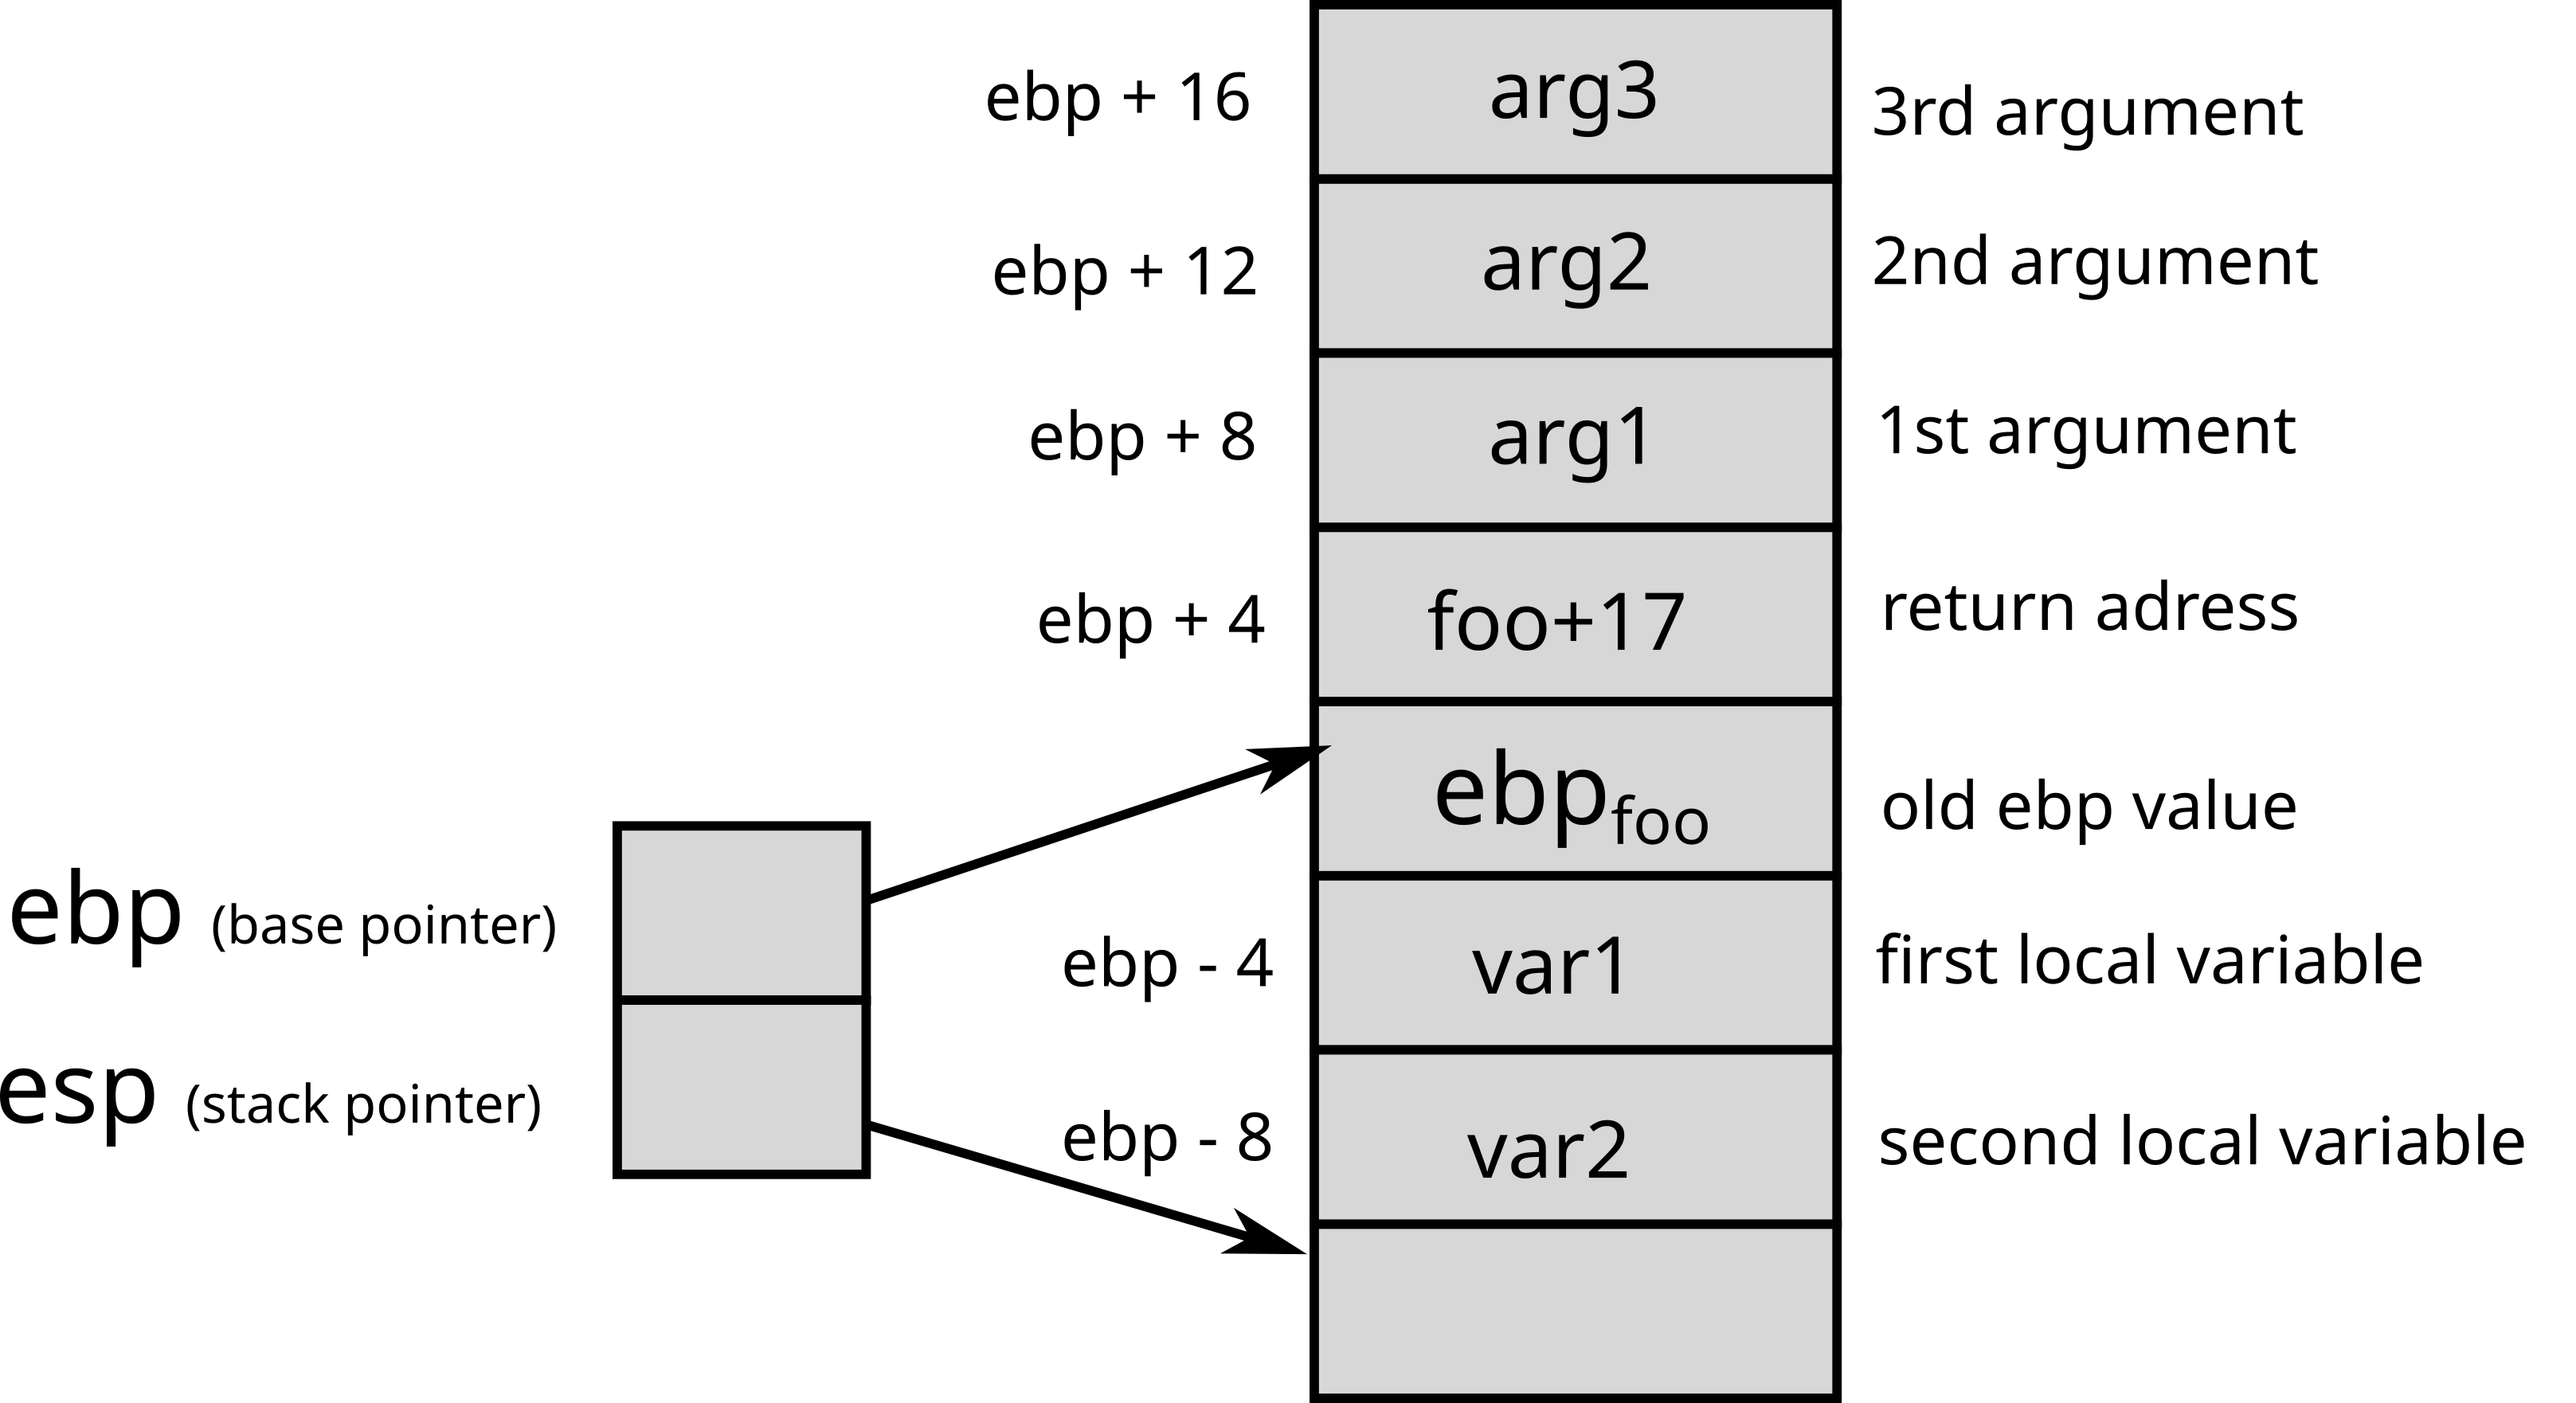
x86 32 bitsOn 32-bit x86 architectures, parameters are placed on
the stack so that the first argument is located at address
ebp + 8, the second at address ebp + 12 (if
the first argument is stored on 4 bytes), etc.
The return address (i.e. the address of the instruction to run after
function) is stored on the stack at the address ebp+4.
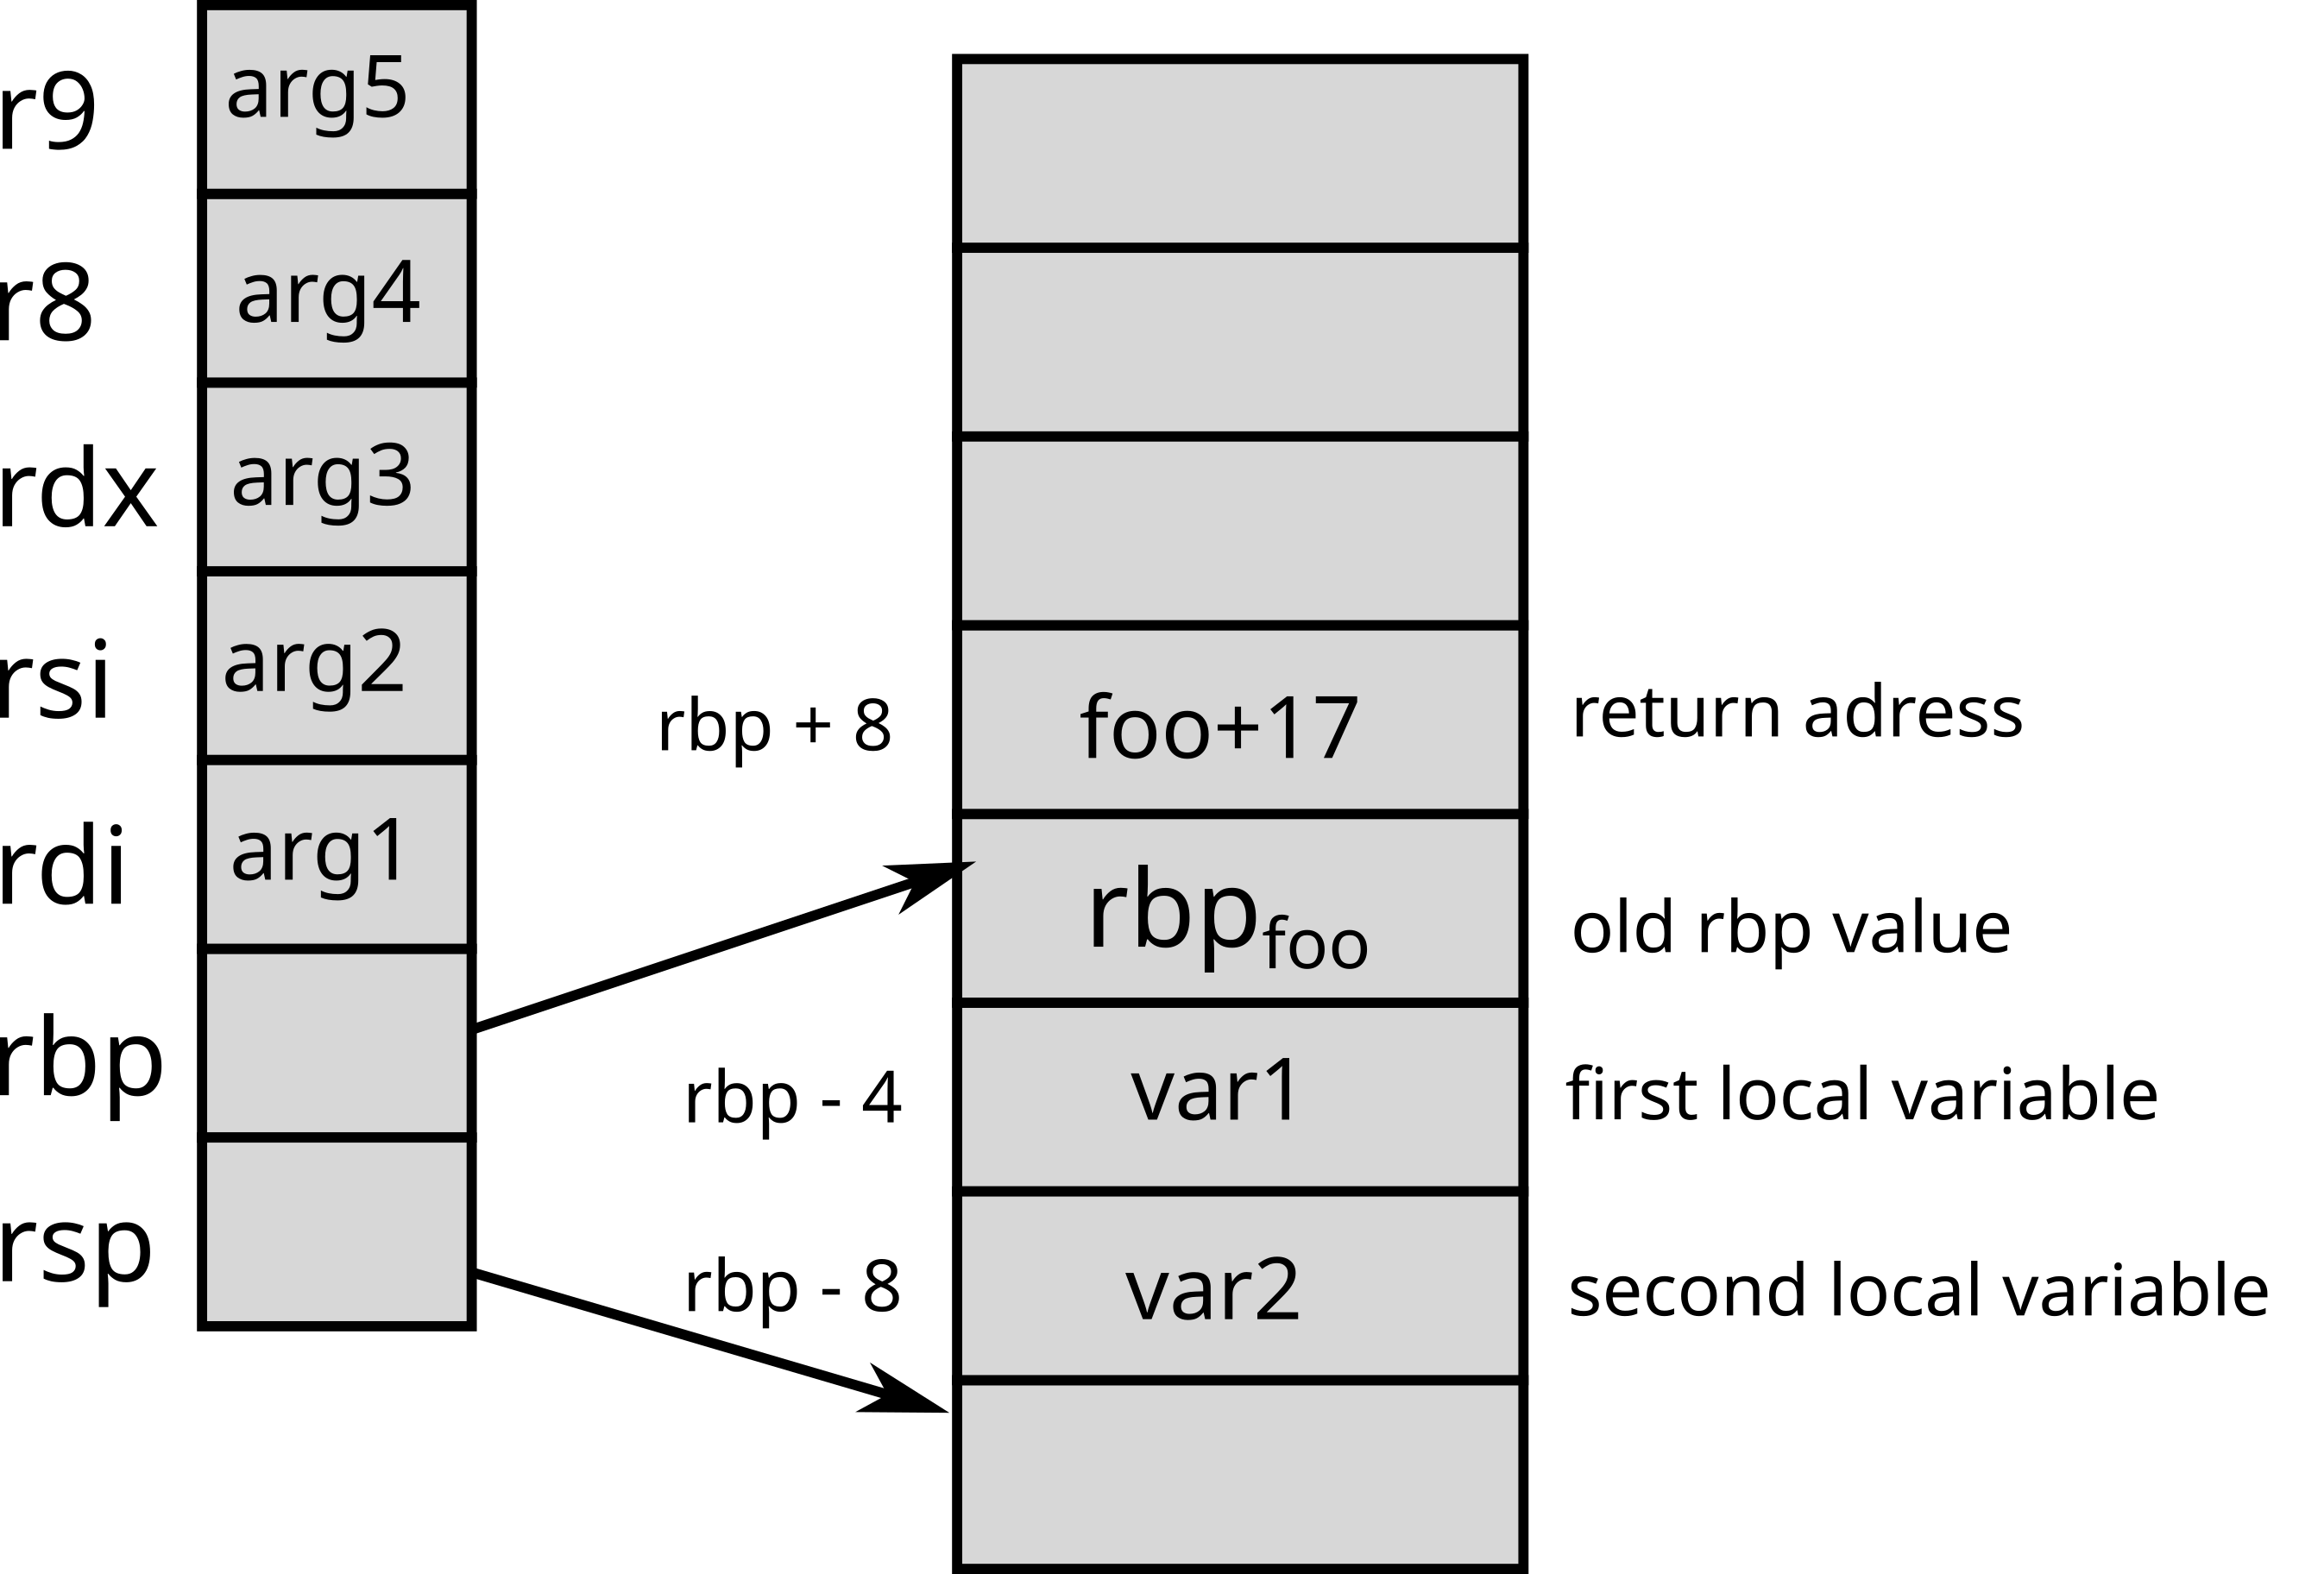
x86 64 bits On 64-bit x86 architectures, the parameters are passed
via the rdi, rsi, rdx,
rcx, r8 and r9 registers. If
there are more than 6 parameters, the next parameters are placed on the
stack.
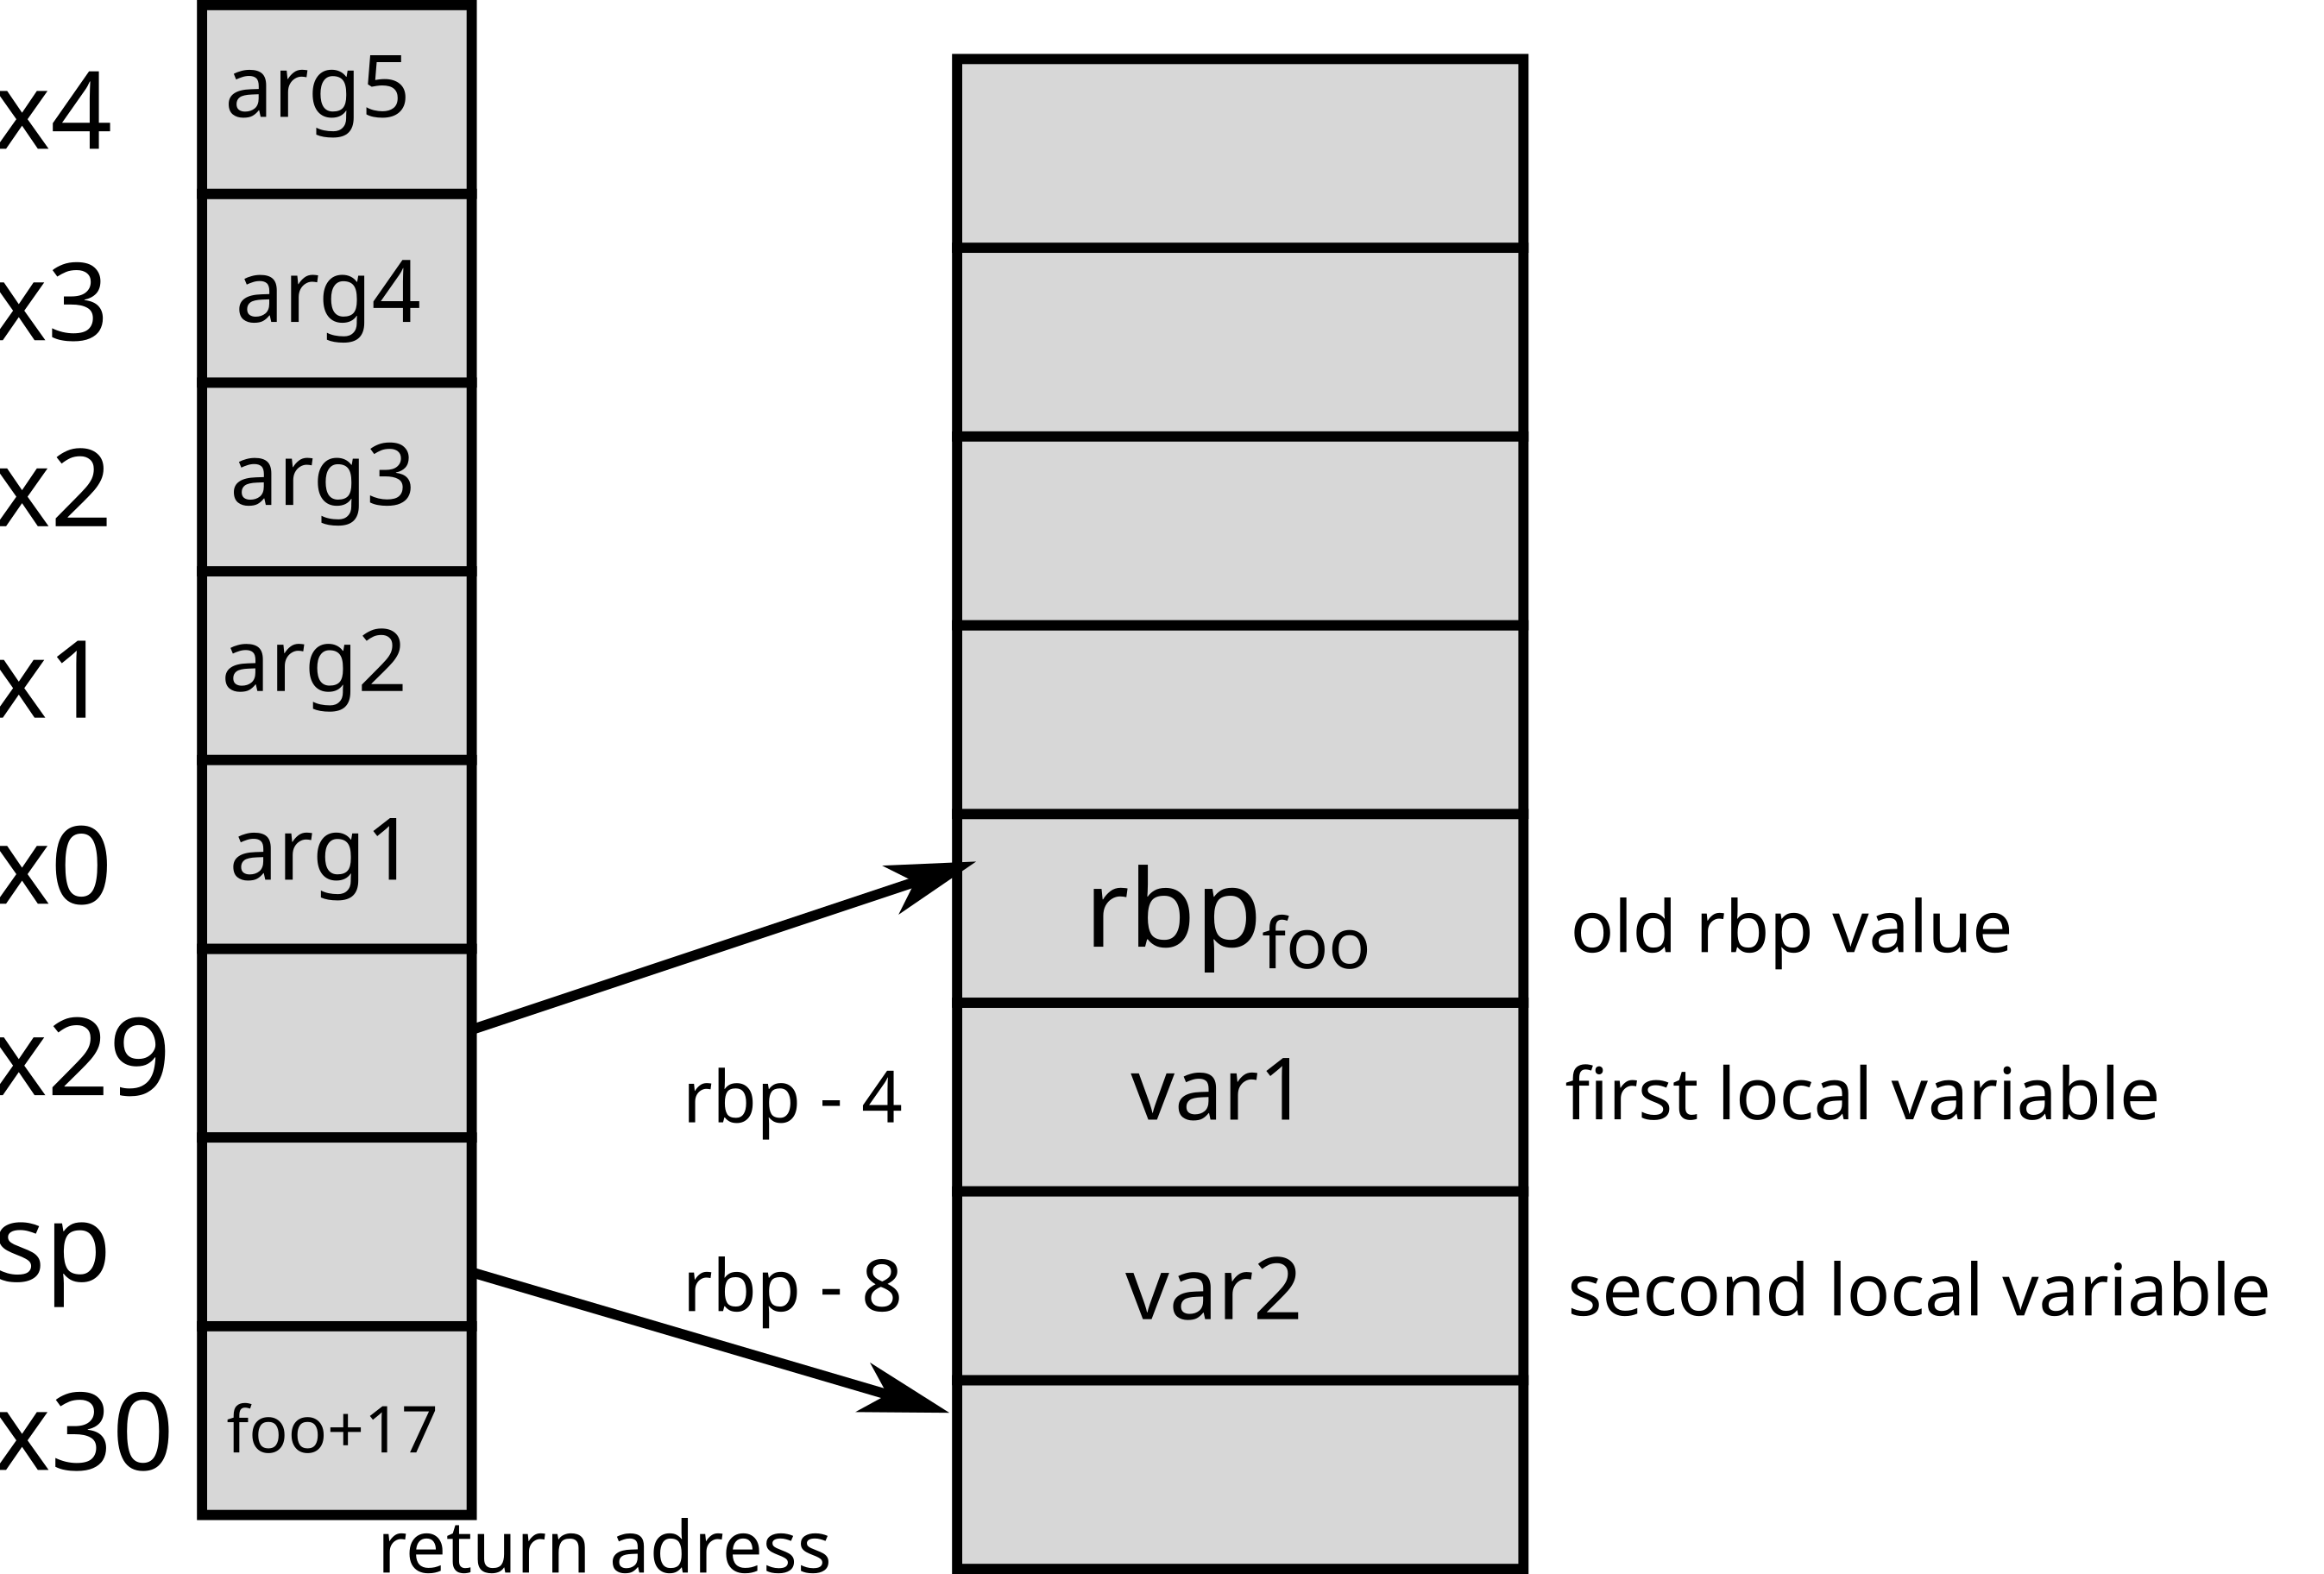
ArmOn Arm architectures, parameters are passed via
registers (x0 to x7 on Arm 64
bits). The return address is also stored in a register.
RISC-VOn RISC-V architectures, parameters are passed via
registers (a0 to a7) like Arm. If
there are more parameters, or their values do not fit in 64 bits
registers, they are placed on the stack. The return address is also
stored in a register. The address of the previous stack frame is not
kept, the compiler issues an instruction to increment the stack pointer
back to the previous stack frame. It means the preamble and epilogue of
compiled functions are slightly more complicated [riasanovsky].
Here is an example of buffer overflow:
#include <stdio.h>
#include <stdlib.h>

int main(int argc, char**argv) {

  int N = 4;
  char tab[N];
  int a = 17;

  for(int i=0; i<=N ; i++) {
    tab[i] = 'a'+i;
  }

  printf("tab = {%c, %c, %c, %c}\n", tab[0], tab[1], tab[2], tab[3]);
  printf("a = %d\n", a);
  return 0;
}Here, the bug comes from the loop in charge of filling the array
which iterates too many times (because of <=. After the
first 4 iterations, here is the memory status:
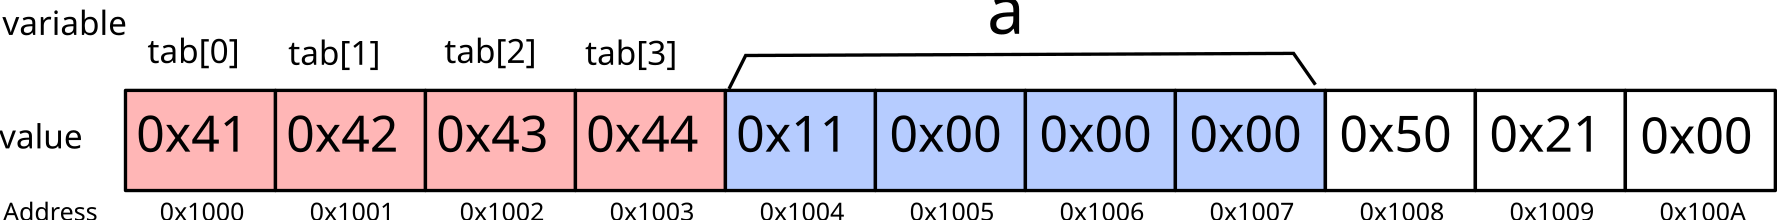
During the fifth iteration, the modification of tab [4]
may modify one byte of the variable a: 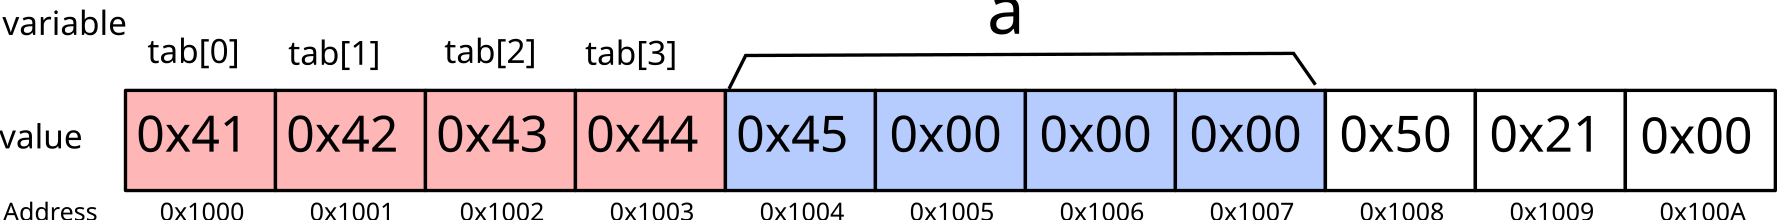
The variable a is therefore no longer equal to
17, but 69 (or 0x45).
Buffer overflow bugs are potentially serious for the
security of a system, because depending on an input (e.g. a string
entered by the user), the bug may modify the behavior of the application
(without necessarily crashing the program). In our example, if
the variable a matches the username, the bug could allow
attackers to pretend to be someone else (for example, an
administrator)!
Buffer overflows are among the most common security vulnerabilities. To be convinced of this, just look for the vulnerability announcements that mention “buffer overflow” (around 17,772 vulnerabilities in 2025).
Here is an example of stack overflow:
#include <stdio.h>
#include <stdlib.h>
#include <string.h>

void foo(char* str) {
  char new_str[16];
  strcpy(new_str, str);
  printf("new_str = %s\n", new_str);
}

int main(int argc, char**argv) {

  foo(argv[1]);
  printf("Back in main()\n");
  return 0;
}
Here, the foo function does not check that
new_str is large enough to hold str. So if
str is too long, strcpy overflows and may
overwrite the return address of foo.
Here is an example of execution leading to an stack overflow:
  $ gdb ./stack_overflow
  (gdb) r coucouAAAAAAAAAAAAAAAAAAAAAAAAAAAAAAAAAAAAAAAAAAAAAAAAAAAAAAAAAAAAAAAAAAAAAAAAAAAAAAAAAAA
The program being debugged has been started already.
Start it from the beginning? (y or n) y
Starting program: stack_overflow coucouAAAAAAAAAAAAAAAAAAAAAAAAAAAAAAAAAAAAAAAAAAAAAAAAAAAAAAAAAAAAAAAAAAAAAAAAAAAAAAAAAAA
new_str = coucouAAAAAAAAAAAAAAAAAAAAAAAAAAAAAAAAAAAAAAAAAAAAAAAAAAAAAAAAAAAAAAAAAAAAAAAAAAAAAAAAAAA

Program received signal SIGSEGV, Segmentation fault.
0x000055555555518e in foo (str=0x7fffffffe03e "coucou", 'A' <repeats 83 times>) at stack_overflow.c:9
9       }
(gdb) bt
#0  0x000055555555518e in foo (str=0x7fffffffe03e "coucou", 'A' <repeats 83 times>) at stack_overflow.c:9
#1  0x4141414141414141 in ?? ()
#2  0x4141414141414141 in ?? ()
#3  0x4141414141414141 in ?? ()
#4  0x4141414141414141 in ?? ()
#5  0x4141414141414141 in ?? ()
#6  0x4141414141414141 in ?? ()
#7  0x4141414141414141 in ?? ()
#8  0x4141414141414141 in ?? ()
#9  0x0000555555550041 in ?? ()
#10 0x0000000000000000 in ?? ()
(gdb)
Here, we observe that when exiting the foo function, the
program tries to execute the instruction located at the address
0x4141414141414141 (0x41 is the hexadecimal
value of 'A'), which generates an error.
We could exploit the bug by inserting in argv [1] the
address of the function void bar (int a, int b) as well as
its parameters [aleph1996].
strcpy,
gets …)
strncpy,
fgets …)-fstack-protector-all option in gccThe implementation of the two operating modes is dependent on the processor architecture.
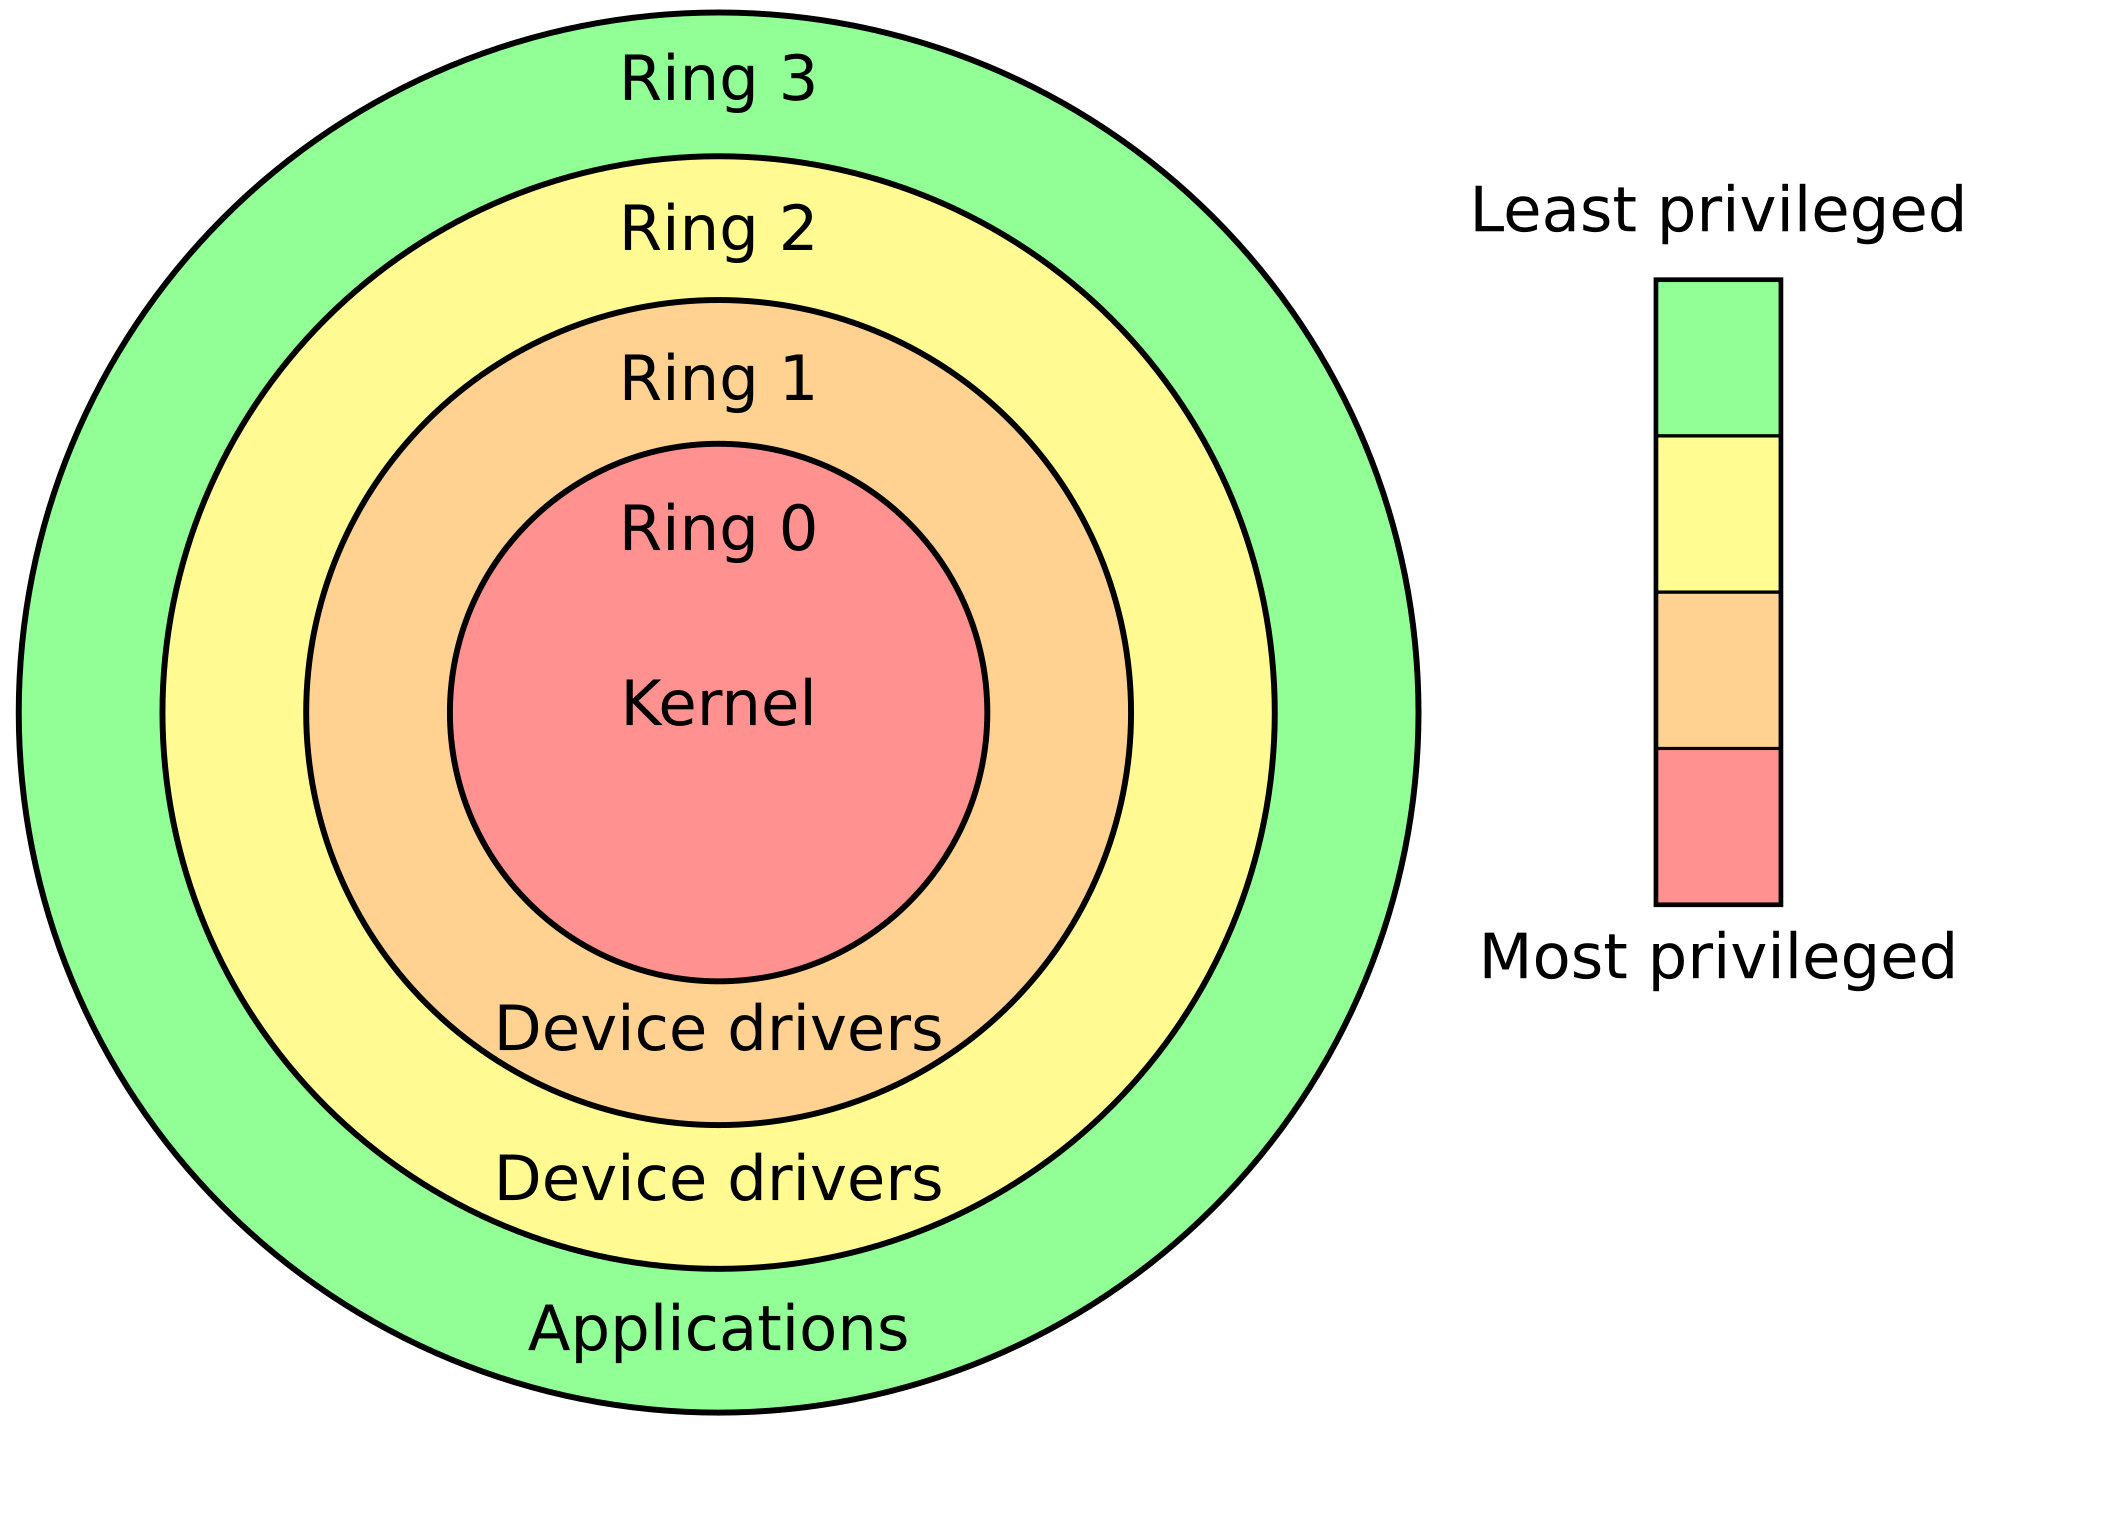
x86On x86, there are four privilege levels called
protection rings. Today, only two are used:
Two intermediate ones were used in a model where device drivers would run separately from the kernel.
RISC-VDepending on the implemented platform, RISC-V uses up to
three levels (sometimes called privilege modes).
From most privileged to less privileged:
M): the level at which the firmware
runsS) : the kernel levelU) : the level for normal user
applications
syscall function
to handle ecallecall instructionecall
handler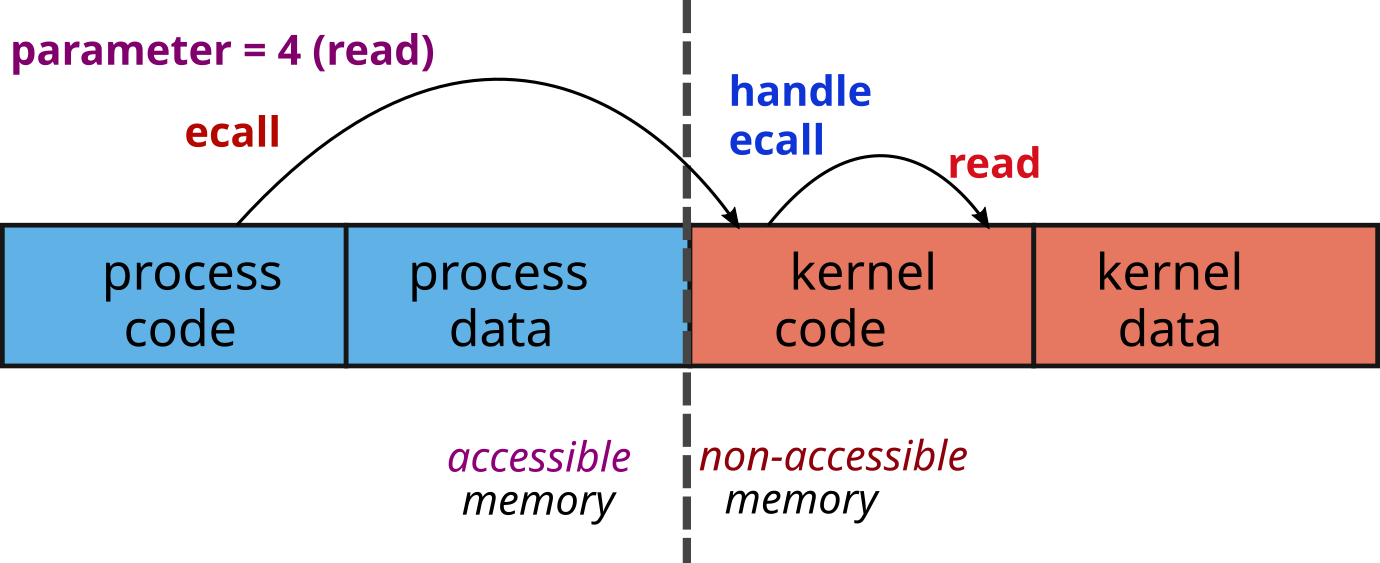
Depending on the type of processor, the way of making a system call may vary. The way to pass the parameters is a convention which can vary from one OS to another. For example, for Linux:
x86_32ebx
ecx, edx, esi, edi,
and ebp registers;eax
register;INT 0x80;eax register.x86_64rdi, rsi, rdx, rcx,
r8, and r9 registers;rax
register;syscall
instruction ;rax register.x0
to x5 registers;x8
register;svc 0
instruction;x0
register.RISC-VThe parameters of the system call are stored in the
a0 to a5 registers;
The system call number is loaded in the a7
register;
Switching to kernel mode is done with the ecall
instructions
ecall is the generic instruction for a privilege level
to call into the immediately-lower privilege level, i.e., from
U to S and from S to
M;The return value of the system call is stored in the
a0 register.
[riasanovsky] Riasanovsky, Nick. “Understanding RISC-V calling convention.” EECS Department, University of California, Berkeley, Tech. Rep.[Online]. Available: https://inst.eecs.berkeley.edu/~cs61c/resources/RISCV_Calling_Convention.pdf
[aleph1996] Aleph, One. “Smashing the stack for fun and profit” Phrack #49, 1996. [Online]. Available: https://phrack.org/issues/49/1